BMW 2011 Annual Report Download - page 52
Download and view the complete annual report
Please find page 52 of the 2011 BMW annual report below. You can navigate through the pages in the report by either clicking on the pages listed below, or by using the keyword search tool below to find specific information within the annual report.-
 1
1 -
2
-
3
-
4
-
5
-
6
-
7
-
8
-
9
-
10
-
11
-
12
-
13
-
14
-
15
-
16
-
17
-
18
-
19
-
20
-
21
-
22
-
23
-
24
-
25
-
26
-
27
-
28
-
29
-
30
-
31
-
32
-
33
-
34
-
35
-
36
-
37
-
38
-
39
-
40
-
41
-
 42
42 -
 43
43 -
 44
44 -
 45
45 -
 46
46 -
 47
47 -
 48
48 -
 49
49 -
 50
50 -
 51
51 -
 52
52 -
 53
53 -
 54
54 -
 55
55 -
 56
56 -
 57
57 -
 58
58 -
 59
59 -
 60
60 -
 61
61 -
 62
62 -
63
-
64
-
65
-
66
-
67
-
68
-
69
-
70
-
71
-
72
-
73
-
74
-
75
-
76
-
77
-
78
-
79
-
80
-
81
-
82
-
83
-
84
-
85
-
86
-
87
-
88
-
89
-
90
-
91
-
92
-
93
-
94
-
95
-
96
-
97
-
98
-
99
-
100
-
101
-
102
-
103
-
104
-
105
-
106
-
107
-
108
-
109
-
110
-
111
-
112
-
113
-
114
-
115
-
116
-
117
-
118
-
119
-
120
-
121
-
122
-
123
-
124
-
125
-
126
-
127
-
128
-
129
-
130
-
131
-
132
-
133
-
134
-
135
-
136
-
137
-
138
-
139
-
140
-
141
-
142
-
143
-
144
-
145
-
146
-
147
-
148
-
149
-
150
-
151
-
152
-
153
-
154
-
155
-
156
-
157
-
158
-
159
-
160
-
161
-
162
-
163
-
164
-
165
-
166
-
167
-
168
-
169
-
170
-
171
-
172
-
173
-
174
-
175
-
176
-
177
-
178
-
179
-
180
-
181
-
182
-
183
-
184
-
185
-
186
-
187
-
188
-
189
-
190
-
191
-
192
-
193
-
194
-
195
-
196
-
197
-
198
-
199
-
200
-
201
-
202
-
203
-
204
-
205
-
206
-
207
-
208
-
209
-
210
-
211
-
212
-
213
-
214
-
215
-
216
-
217
-
218
-
219
-
220
-
221
-
222
-
223
-
224
-
225
-
226
-
227
-
228
-
229
-
230
-
231
-
232
-
233
-
234
-
235
-
236
-
237
-
238
-
239
-
240
-
241
-
242
-
243
-
244
-
245
-
246
-
247
-
248
-
249
-
250
-
251
-
252
-
253
-
254
-
255
-
256
-
257
-
258
-
259
-
260
-
261
-
262
-
263
-
264
-
265
-
266
-
267
-
268
-
269
-
270
-
271
-
272
-
273
-
274
-
275
-
276
-
277
-
278
-
279
-
280
-
281
-
282
 |
 |

52
18 COMBINED GROUP AND COMPANY
MANAGEMENT REPORT
18 A Review of the Financial Year
20 General Economic Environment
24 Review of Operations
43 BMW Stock and Capital Market
46 Disclosures relevant for takeovers
and explanatory comments
49 Financial Analysis
49 Internal Management System
51 Earnings Performance
53 Financial Position
56 Net Assets Position
59 Subsequent Events Report
59 Value Added Statement
61 Key Performance Figures
62 Comments on BMW AG
66 Internal Control System and
explanatory comments
67 Risk Management
73 Outlook
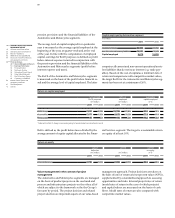
Revenues generated by the BMW Group in the Africa,
Asia and Oceania regions increased by 25.4 %. Strong
eco-
nomic growth in China gave a 37.3 % boost to revenues.
In the Rest of Europe region (i.e. excluding Germany)
and the Americas region revenues grew by 12.8 % and
0.8 % respectively. In Germany, where revenues had
fallen in the previous year, they rose by 14.7 %.
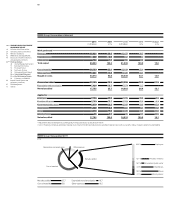
Group cost of sales increased by 9.5 % to € 54,276 million
(2010: € 49,545 million), rising therefore at a slower rate
than revenues. The main factors here were slower in-
creases in manufacturing costs and lower refinancing
costs. Gross profit increased as a result by 33.0 % to
€ 14,545 million, giving a gross profit
margin
of 21.1 %
(2010: 18.1 %).
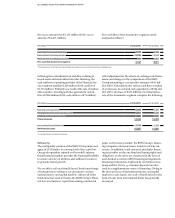
The gross profit margin recorded by the Automotive
segment was 20.7 % (2010: 17.4 %) and that of the
Motor-
cycles segment was 15.9 % (2010: 16.0 %). The Financial
Services segment’s gross profit margin improved by
3.4 percentage points to 14.3 %.
Research and development costs increased by 17.1 % to
€ 3,610 million, in part due to activities related to the
electrification of the future product range. As a percent-
age of revenues, the research and development cost ra-
tio went up by 0.1 percentage point to 5.2 %. Research
and development costs include amortisation of capi-
talised development costs amounting to € 1,209 million
(2010: € 1,260 million). Total research and develop-
ment expenditure amounted to € 3,373 million (2010:
€ 2,773 million). This figure comprises research costs,
non-capitalised development costs, capitalised develop-
ment costs and the systematic amortisation expense
relating to capitalised development costs. The research
and development expenditure ratio for 2011 was 4.9 %
(2010: 4.6 %). The proportion of development costs
recognised as assets in 2011 was 28.8 % (2010: 34.3 %).
Sales costs went up due to increased volumes, while ad-
ministrative costs rose as a result of the higher profit
share paid to employees. Overall, costs were up 11.7 %
compared to the previous year. As a percentage of
revenues, the sales and administrative cost ratio fell by
0.1 percentage points to 9.0 %.
Depreciation and amortisation on property, plant and
equipment and intangible assets recorded in cost of
sales and in sales and administrative costs amounted to
€ 3,646 million (2010: € 3,682 million).
The net expense reported for other operating income
and other operating expenses increased by € 58 million
to € 350 million, mainly as a result of higher allocations
to provisions.
As a result of the positive factors referred to above, the
profit before financial result amounted to € 8,018 million
(2010: € 5,111 million).
The financial result was a net expense of € 635 million,
which represented a deterioration of € 377 million against
the previous year (2010: net expense of € 258
million).
This development mainly reflected fair value losses in-
curred on commodity derivatives and on stand-alone in-
terest rate derivatives which caused sundry other finan-
cial
result to deteriorate by € 706 million. The result
from investments improved by € 164 million, reducing
the net expense for the year to € 7 million. The previous
year’s net expense of € 171 million was negatively im-
pacted by impairment losses recognised on investments
in affiliated companies. Overall, other financial result
deteriorated by € 542 million to a net expense of € 617
million. The result from equity accounted investments
improved by € 64 million to € 162 million. In addition
to the Group’s share of results from its equity accounted
investments in BMW Brilliance Automotive Ltd., Shen-
yang, and the Cirquent Group, this also includes for
the first time the Group’s share of results from joint
ventures with the SGL Carbon Group, from the two new
DriveNow entities and from the newly founded joint
venture with Peugeot SA. Within the financial result, the
net interest result improved by € 101 million.
Taking all these factors into consideration, the profit be-
fore tax improved to € 7,383 million (2010: € 4,853 mil-
lion). The pre-tax return on sales was 10.7 % (2010: 8.0 %).
Income tax expense amounted to € 2,476 million (2010:
€ 1,610 million), resulting in an effective tax rate of
33.5 % (2010: 33.2 %).
Overall, the BMW Group recorded a net profit of € 4,907
million (2010: € 3,243 million) for the financial year 2011.
The post-tax return on sales was 7.1 % (2010: 5.4 %).
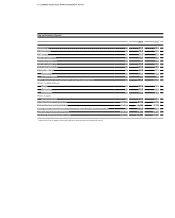
Revenues of the Automotive segment rose by 16.8 %,
while segment profit before tax jumped to
€ 6,823 mil-
lion (2010: € 3,887 million). Sales volume was 14.2 % up
on the previous year.
In the Motorcycles segment, the number of BMW brand
motorcycles handed over to customers increased by
6.4 %. Sales of Husqvarna brand motorcycles fell by 23.0 %
compared to the previous year. Segment revenues rose
by 10.1 %. The segment profit before tax fell by € 24 mil-