BMW 2011 Annual Report Download - page 54
Download and view the complete annual report
Please find page 54 of the 2011 BMW annual report below. You can navigate through the pages in the report by either clicking on the pages listed below, or by using the keyword search tool below to find specific information within the annual report.-
 1
1 -
2
-
3
-
4
-
5
-
6
-
7
-
8
-
9
-
10
-
11
-
12
-
13
-
14
-
15
-
16
-
17
-
18
-
19
-
20
-
21
-
22
-
23
-
24
-
25
-
26
-
27
-
28
-
29
-
30
-
31
-
32
-
33
-
34
-
35
-
36
-
37
-
38
-
39
-
40
-
41
-
42
-
43
-
 44
44 -
 45
45 -
 46
46 -
 47
47 -
 48
48 -
 49
49 -
 50
50 -
 51
51 -
 52
52 -
 53
53 -
 54
54 -
 55
55 -
 56
56 -
 57
57 -
 58
58 -
 59
59 -
 60
60 -
 61
61 -
 62
62 -
 63
63 -
 64
64 -
65
-
66
-
67
-
68
-
69
-
70
-
71
-
72
-
73
-
74
-
75
-
76
-
77
-
78
-
79
-
80
-
81
-
82
-
83
-
84
-
85
-
86
-
87
-
88
-
89
-
90
-
91
-
92
-
93
-
94
-
95
-
96
-
97
-
98
-
99
-
100
-
101
-
102
-
103
-
104
-
105
-
106
-
107
-
108
-
109
-
110
-
111
-
112
-
113
-
114
-
115
-
116
-
117
-
118
-
119
-
120
-
121
-
122
-
123
-
124
-
125
-
126
-
127
-
128
-
129
-
130
-
131
-
132
-
133
-
134
-
135
-
136
-
137
-
138
-
139
-
140
-
141
-
142
-
143
-
144
-
145
-
146
-
147
-
148
-
149
-
150
-
151
-
152
-
153
-
154
-
155
-
156
-
157
-
158
-
159
-
160
-
161
-
162
-
163
-
164
-
165
-
166
-
167
-
168
-
169
-
170
-
171
-
172
-
173
-
174
-
175
-
176
-
177
-
178
-
179
-
180
-
181
-
182
-
183
-
184
-
185
-
186
-
187
-
188
-
189
-
190
-
191
-
192
-
193
-
194
-
195
-
196
-
197
-
198
-
199
-
200
-
201
-
202
-
203
-
204
-
205
-
206
-
207
-
208
-
209
-
210
-
211
-
212
-
213
-
214
-
215
-
216
-
217
-
218
-
219
-
220
-
221
-
222
-
223
-
224
-
225
-
226
-
227
-
228
-
229
-
230
-
231
-
232
-
233
-
234
-
235
-
236
-
237
-
238
-
239
-
240
-
241
-
242
-
243
-
244
-
245
-
246
-
247
-
248
-
249
-
250
-
251
-
252
-
253
-
254
-
255
-
256
-
257
-
258
-
259
-
260
-
261
-
262
-
263
-
264
-
265
-
266
-
267
-
268
-
269
-
270
-
271
-
272
-
273
-
274
-
275
-
276
-
277
-
278
-
279
-
280
-
281
-
282
 |
 |
54
18 COMBINED GROUP AND COMPANY
MANAGEMENT REPORT
18 A Review of the Financial Year
20 General Economic Environment
24 Review of Operations
43 BMW Stock and Capital Market
46 Disclosures relevant for takeovers
and explanatory comments
49 Financial Analysis
49 Internal Management System
51 Earnings Performance
53 Financial Position
56 Net Assets Position
59 Subsequent Events Report
59 Value Added Statement
61 Key Performance Figures
62 Comments on BMW AG
66 Internal Control System and
explanatory comments
67 Risk Management
73 Outlook
year. The increase in net profit to € 4,907 million in-
creased cash inflows by € 1,664 million. Changes in
working capital reduced cash flows from operating ac-
tivities by € 1,212 million, mainly reflecting the effect
of stocking-up in conjunction with the introduction of
new models. This compared with changes in other
oper-
ating assets and liabilities (up by € 603 million) and
the change in non-cash relevant income and expenses
(up by € 842 million), which resulted in an increase in
the cash inflow from operating activities. The change
in leased assets and in receivables from sales financing
increased cash inflows in 2011 by € 512 million com-
pared to the previous year.
The cash outflow for investing activities amounted to
€ 5,499 million and was therefore € 309 million higher
than in 2010. Capital expenditure on intangible assets
and property, plant and equipment resulted in the cash
outflow for investing activities increasing by € 416 mil-
lion compared to the previous year. Net cash used in
acquiring the ICL Group totalled € 595 million. Cash out-
flows for investments were € 463 million higher than
in the previous year. By contrast, the net change in mar-
ketable securities resulted in a € 1,169 million reduction
in cash outflows for investing activities.
Financing activities generated a cash inflow of € 87
mil-
lion in 2011, € 423 million lower than in the previous year
(2010: cash inflow of € 510 million). Proceeds from the
issue of bonds totalled € 5,899 million (2010: € 4,578 mil-
lion), compared with an outflow of € 5,333 million (2010:
€ 3,406 million) for the repayment of bonds.
The dividend payment in the financial year 2011
amountes to € 852 million (2010: € 197 million). The cash
inflow for other financial liabilities and commercial paper
was € 439 million (2010: cash outflow of € 260 million).
The cash inflow from operating activities exceeded the
cash outflow for investing activities by € 214 million in
the financial year 2011. In the previous year, there was a
shortfall of € 871 million.
The cash flow statement for the Automotive segment
shows that the cash inflow from operating activities ex-
ceeded the cash outflow for investing activities by € 1,352
million (2010: € 2,608 million).
Adjusted for net investments in marketable securities
amounting to € 781 million (2010: € 1,863 million),
mainly in conjunction with strategic liquidity planning,
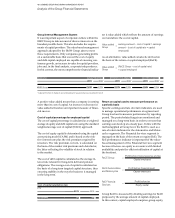
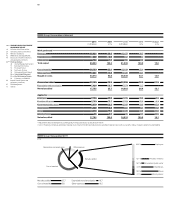
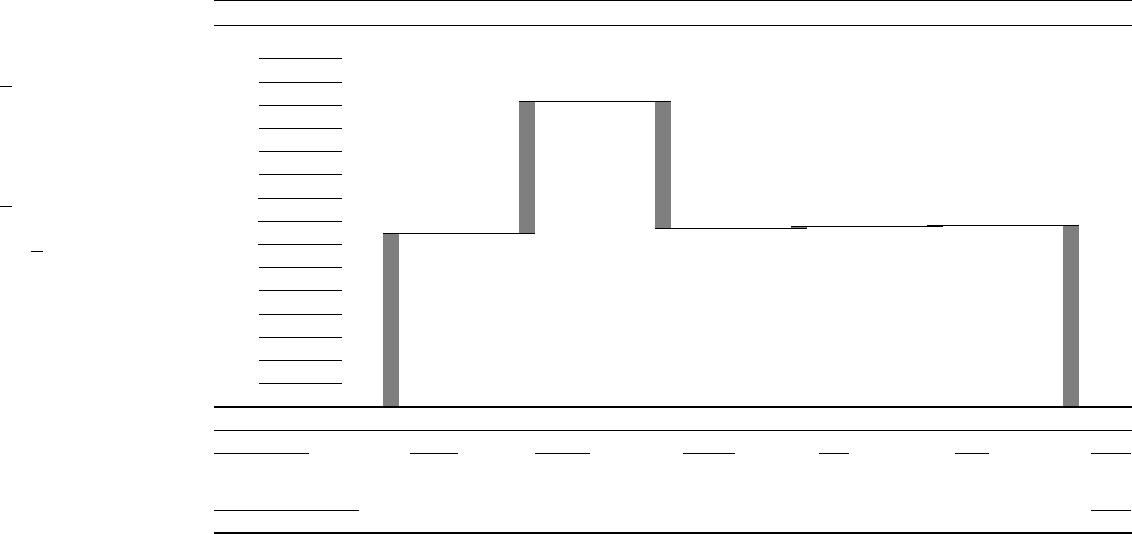
Change in cash and cash equivalents
in € million
15,000
14,000
13,000
12,000
11,000
10,000
9,000
8,000
7,000
6,000
5,000
4,000
3,000
2,000
1,000
Cash and cash Cash inflow Cash outflow Cash inflow Currency trans- Cash and cash
equivalents from operating from investing from financing lation, changes in equivalents
31.12. 2010 activities activities activities Group composition 31.12. 2011
7,432 + 5,713 – 5,499 + 87 + 43 7,776