BMW 2011 Annual Report Download - page 112
Download and view the complete annual report
Please find page 112 of the 2011 BMW annual report below. You can navigate through the pages in the report by either clicking on the pages listed below, or by using the keyword search tool below to find specific information within the annual report.-
 1
1 -
2
-
3
-
4
-
5
-
6
-
7
-
8
-
9
-
10
-
11
-
12
-
13
-
14
-
15
-
16
-
17
-
18
-
19
-
20
-
21
-
22
-
23
-
24
-
25
-
26
-
27
-
28
-
29
-
30
-
31
-
32
-
33
-
34
-
35
-
36
-
37
-
38
-
39
-
40
-
41
-
42
-
43
-
44
-
45
-
46
-
47
-
48
-
49
-
50
-
51
-
52
-
53
-
54
-
55
-
56
-
57
-
58
-
59
-
60
-
61
-
62
-
63
-
64
-
65
-
66
-
67
-
68
-
69
-
70
-
71
-
72
-
73
-
74
-
75
-
76
-
77
-
78
-
79
-
80
-
81
-
82
-
83
-
84
-
85
-
86
-
87
-
88
-
89
-
90
-
91
-
92
-
93
-
94
-
95
-
96
-
97
-
98
-
99
-
100
-
101
-
 102
102 -
 103
103 -
 104
104 -
 105
105 -
 106
106 -
 107
107 -
 108
108 -
 109
109 -
 110
110 -
 111
111 -
 112
112 -
 113
113 -
 114
114 -
 115
115 -
 116
116 -
 117
117 -
 118
118 -
 119
119 -
 120
120 -
 121
121 -
 122
122 -
123
-
124
-
125
-
126
-
127
-
128
-
129
-
130
-
131
-
132
-
133
-
134
-
135
-
136
-
137
-
138
-
139
-
140
-
141
-
142
-
143
-
144
-
145
-
146
-
147
-
148
-
149
-
150
-
151
-
152
-
153
-
154
-
155
-
156
-
157
-
158
-
159
-
160
-
161
-
162
-
163
-
164
-
165
-
166
-
167
-
168
-
169
-
170
-
171
-
172
-
173
-
174
-
175
-
176
-
177
-
178
-
179
-
180
-
181
-
182
-
183
-
184
-
185
-
186
-
187
-
188
-
189
-
190
-
191
-
192
-
193
-
194
-
195
-
196
-
197
-
198
-
199
-
200
-
201
-
202
-
203
-
204
-
205
-
206
-
207
-
208
-
209
-
210
-
211
-
212
-
213
-
214
-
215
-
216
-
217
-
218
-
219
-
220
-
221
-
222
-
223
-
224
-
225
-
226
-
227
-
228
-
229
-
230
-
231
-
232
-
233
-
234
-
235
-
236
-
237
-
238
-
239
-
240
-
241
-
242
-
243
-
244
-
245
-
246
-
247
-
248
-
249
-
250
-
251
-
252
-
253
-
254
-
255
-
256
-
257
-
258
-
259
-
260
-
261
-
262
-
263
-
264
-
265
-
266
-
267
-
268
-
269
-
270
-
271
-
272
-
273
-
274
-
275
-
276
-
277
-
278
-
279
-
280
-
281
-
282
 |
 |

112
76 GROUP FINANCIAL STATEMENTS
76 Income Statements
76 Statement of
Comprehensive Income
78 Balance Sheets
80 Cash Flow Statements
82 Group Statement of Changes
in Equity
84 Notes
84 Accounting Principles
and Policies
100 Notes to the Income
Statement
107 Notes to the Statement
of Comprehensive Income
108
Notes to the Balance Sheet
129 Other Disclosures
145 Segment Information
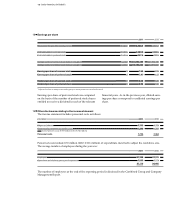
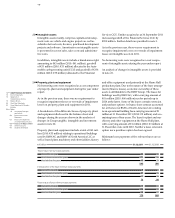
in € million 31. 12. 2011 31. 12. 2010
Gross investment in finance leases
due within one year 4,217 3,922
due between one and five years 7,933 7,185
due later than five years 102 56
12,252 11,163
Present value of future minimum lease payments
due within one year 3,725 3,409
due between one and five years 7,233 6,446
due later than five years 92 50
11,050 9,905
Unrealised interest income 1,202 1,258
27
Receivables from sales financing
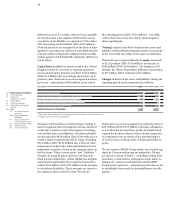
Receivables from sales financing, totalling € 49,345 mil-
lion (2010: € 45,365 million), comprise € 38,295 million
(2010: € 35,460 million) for credit financing for retail
Additions relate primarily to the purchase of shares in
SGL Carbon SE, Wiesbaden.
A break-down of the different classes of other invest-
customers and dealers and € 11,050 million (2010:
€ 9,905 million) for finance leases. Finance leases are an-
alysed as follows:
ments disclosed in the balance sheet and changes dur-
ing the year are shown in the analysis of changes in
Group tangible, intangible and investment assets in
note 22.
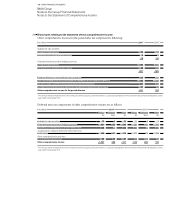
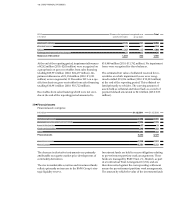
in € million 31. 12. 2011 31. 12. 2010
Gross carrying amount 50,961 46,961
Allowance for impairment – 1,616 – 1,596
Net carrying amount 49,345 45,365
2011 Allowance for impairment recognised on a Total
in € million specific item basis group basis
Balance at 1 January* 1,455 208 1,663
Allocated / reversed 233 67 300
Utilised – 315 – 14 – 329
Exchange rate impact and other changes – 19 1 – 18
Balance at 31 December 1,354 262 1,616
* including entities consolidated for the first time during the financial year
Contingent rents recognised as income (generally re-
lating to the distance driven) amounted to € 2 million
(2010: € 3 million). Write-downs on finance leases
amounting to € 77 million (2010: € 68 million) were
measured and recognised on the basis of specific
credit risks. As in the previous year, there are no un-
guaranteed residual values that fall to the benefit of
the lessor.
Receivables from sales financing include € 29,331 mil-
lion (2010: € 27,126 million) with a remaining term of
more than one year.
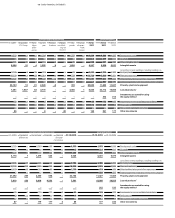
Allowance for impairment and credit risk
Allowances for impairment on receivables from sales financing developed as following during the year under report: