BMW 2011 Annual Report Download - page 140
Download and view the complete annual report
Please find page 140 of the 2011 BMW annual report below. You can navigate through the pages in the report by either clicking on the pages listed below, or by using the keyword search tool below to find specific information within the annual report.-
 1
1 -
2
-
3
-
4
-
5
-
6
-
7
-
8
-
9
-
10
-
11
-
12
-
13
-
14
-
15
-
16
-
17
-
18
-
19
-
20
-
21
-
22
-
23
-
24
-
25
-
26
-
27
-
28
-
29
-
30
-
31
-
32
-
33
-
34
-
35
-
36
-
37
-
38
-
39
-
40
-
41
-
42
-
43
-
44
-
45
-
46
-
47
-
48
-
49
-
50
-
51
-
52
-
53
-
54
-
55
-
56
-
57
-
58
-
59
-
60
-
61
-
62
-
63
-
64
-
65
-
66
-
67
-
68
-
69
-
70
-
71
-
72
-
73
-
74
-
75
-
76
-
77
-
78
-
79
-
80
-
81
-
82
-
83
-
84
-
85
-
86
-
87
-
88
-
89
-
90
-
91
-
92
-
93
-
94
-
95
-
96
-
97
-
98
-
99
-
100
-
101
-
102
-
103
-
104
-
105
-
106
-
107
-
108
-
109
-
110
-
111
-
112
-
113
-
114
-
115
-
116
-
117
-
118
-
119
-
120
-
121
-
122
-
123
-
124
-
125
-
126
-
127
-
128
-
129
-
 130
130 -
 131
131 -
 132
132 -
 133
133 -
 134
134 -
 135
135 -
 136
136 -
 137
137 -
 138
138 -
 139
139 -
 140
140 -
 141
141 -
 142
142 -
 143
143 -
 144
144 -
 145
145 -
 146
146 -
 147
147 -
 148
148 -
 149
149 -
 150
150 -
151
-
152
-
153
-
154
-
155
-
156
-
157
-
158
-
159
-
160
-
161
-
162
-
163
-
164
-
165
-
166
-
167
-
168
-
169
-
170
-
171
-
172
-
173
-
174
-
175
-
176
-
177
-
178
-
179
-
180
-
181
-
182
-
183
-
184
-
185
-
186
-
187
-
188
-
189
-
190
-
191
-
192
-
193
-
194
-
195
-
196
-
197
-
198
-
199
-
200
-
201
-
202
-
203
-
204
-
205
-
206
-
207
-
208
-
209
-
210
-
211
-
212
-
213
-
214
-
215
-
216
-
217
-
218
-
219
-
220
-
221
-
222
-
223
-
224
-
225
-
226
-
227
-
228
-
229
-
230
-
231
-
232
-
233
-
234
-
235
-
236
-
237
-
238
-
239
-
240
-
241
-
242
-
243
-
244
-
245
-
246
-
247
-
248
-
249
-
250
-
251
-
252
-
253
-
254
-
255
-
256
-
257
-
258
-
259
-
260
-
261
-
262
-
263
-
264
-
265
-
266
-
267
-
268
-
269
-
270
-
271
-
272
-
273
-
274
-
275
-
276
-
277
-
278
-
279
-
280
-
281
-
282
 |
 |

140
76 GROUP FINANCIAL STATEMENTS
76 Income Statements
76 Statement of
Comprehensive Income
78 Balance Sheets
80 Cash Flow Statements
82 Group Statement of Changes
in Equity
84 Notes
84 Accounting Principles
and Policies
100 Notes to the Income
Statement
107 Notes to the Statement
of Comprehensive Income
108
Notes to the Balance Sheet
129 Other Disclosures
145 Segment Information
43
Explanatory notes to the cash flow statements
The cash flow statements show how the cash and cash
equivalents of the BMW Group and of the Automotive
and Financial Services segments have changed in the
course of the year as a result of cash inflows and cash
outflows. In accordance with IAS 7 (Statement of Cash
Flows), cash flows are classified into cash flows from
operating, investing and financing activities.
Cash and cash equivalents included in the cash flow
statement comprise cash in hand, cheques, and cash
at bank, to the extent that they are available within
three months from the end of the reporting period and
are subject to an insignificant risk of changes in value.
The cash flows from investing and financing activities
are based on actual payments and receipts. By con-
trast,
the cash flow from operating activities is derived
Other risks
The BMW Group is exposed to raw material price risks.
A description of the management of these risks is pro-
vided in the Combined Group and Company Manage-
ment Report. In order to reduce these risks, derivative
financial instruments are used that serve to hedge pur-
chase price fluctuations agreed with suppliers with re-
spect to the raw material content of purchases. Changes
in the fair values of these derivatives, which generally
track the quoted market prices of the raw material being
hedged, gives rise to market price risks for the Group.
If the market prices of hedged raw materials had been
10 % higher (lower) at 31 December 2011, the Group
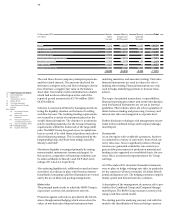
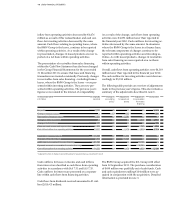
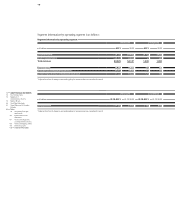
As stated there, the BMW Group applies a value-at-
risk approach for internal reporting purposes and to
manage interest rate risks. This is based on a variance-
covariance method, in which the potential future fair
value losses of the interest rate portfolios are compared
across the Group with expected amounts measured on
the basis of a holding period of ten days and a confi-
dence level of 99 %. Aggregation of these results creates
a risk reduction effect due to correlations between the
various portfolios.
In the following table the potential volume of fair value
fluctuations – measured on the basis of the value-at-risk
approach – are compared with the expected value for
the interest rate relevant positions of the BMW Group
for the three principal currencies:
indirectly from the net profit for the year. Under this
method, changes in assets and liabilities relating to op-
erating activities are adjusted for currency translation
effects and changes in the composition of the Group.
The changes in balance sheet positions shown in the
cash flow statement do not therefore agree directly with
the amounts shown in the Group and segment balance
sheets.
Cash inflows and outflows relating to operating leases,
where the BMW Group is lessor, are required by
IAS 7.14 to be presented within cash flows from operat-
ing activities. In previous financial statements, they
were presented within cash flows from investing activi-
ties. The change in presentation in the BMW Group’s
Cash Flow Statements has been made with effect from
the end of the financial year 2011. Prior year figures
have been adjusted in accordance with IAS 8.42. Cash
profit before tax would have been € 95 million higher
(€ 95 million lower) and accumulated other equity relat-
ing to cash flow hedges would have been € 190 million
higher (€ 190 million lower).
A further exposure relates to the residual value risk on
vehicles returned to the Group at the end of lease con-
tracts. The risks from financial instruments used in this
context were not material to the Group in the past and / or
at the end of the reporting period. A description of the
management of this risk is provided in the Combined
Group and Company Management Report. Information
regarding the residual value risk from operating leases is
provided in the section on accounting policies in note 6.
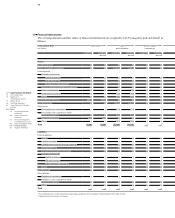
in € million 31. 12. 2011 31. 12. 2010
Euro 38 11
US Dollar 24 27
British Pound 3 4