BMW 2011 Annual Report Download - page 49
Download and view the complete annual report
Please find page 49 of the 2011 BMW annual report below. You can navigate through the pages in the report by either clicking on the pages listed below, or by using the keyword search tool below to find specific information within the annual report.-
 1
1 -
2
-
3
-
4
-
5
-
6
-
7
-
8
-
9
-
10
-
11
-
12
-
13
-
14
-
15
-
16
-
17
-
18
-
19
-
20
-
21
-
22
-
23
-
24
-
25
-
26
-
27
-
28
-
29
-
30
-
31
-
32
-
33
-
34
-
35
-
36
-
37
-
38
-
 39
39 -
 40
40 -
 41
41 -
 42
42 -
 43
43 -
 44
44 -
 45
45 -
 46
46 -
 47
47 -
 48
48 -
 49
49 -
 50
50 -
 51
51 -
 52
52 -
 53
53 -
 54
54 -
 55
55 -
 56
56 -
 57
57 -
 58
58 -
 59
59 -
60
-
61
-
62
-
63
-
64
-
65
-
66
-
67
-
68
-
69
-
70
-
71
-
72
-
73
-
74
-
75
-
76
-
77
-
78
-
79
-
80
-
81
-
82
-
83
-
84
-
85
-
86
-
87
-
88
-
89
-
90
-
91
-
92
-
93
-
94
-
95
-
96
-
97
-
98
-
99
-
100
-
101
-
102
-
103
-
104
-
105
-
106
-
107
-
108
-
109
-
110
-
111
-
112
-
113
-
114
-
115
-
116
-
117
-
118
-
119
-
120
-
121
-
122
-
123
-
124
-
125
-
126
-
127
-
128
-
129
-
130
-
131
-
132
-
133
-
134
-
135
-
136
-
137
-
138
-
139
-
140
-
141
-
142
-
143
-
144
-
145
-
146
-
147
-
148
-
149
-
150
-
151
-
152
-
153
-
154
-
155
-
156
-
157
-
158
-
159
-
160
-
161
-
162
-
163
-
164
-
165
-
166
-
167
-
168
-
169
-
170
-
171
-
172
-
173
-
174
-
175
-
176
-
177
-
178
-
179
-
180
-
181
-
182
-
183
-
184
-
185
-
186
-
187
-
188
-
189
-
190
-
191
-
192
-
193
-
194
-
195
-
196
-
197
-
198
-
199
-
200
-
201
-
202
-
203
-
204
-
205
-
206
-
207
-
208
-
209
-
210
-
211
-
212
-
213
-
214
-
215
-
216
-
217
-
218
-
219
-
220
-
221
-
222
-
223
-
224
-
225
-
226
-
227
-
228
-
229
-
230
-
231
-
232
-
233
-
234
-
235
-
236
-
237
-
238
-
239
-
240
-
241
-
242
-
243
-
244
-
245
-
246
-
247
-
248
-
249
-
250
-
251
-
252
-
253
-
254
-
255
-
256
-
257
-
258
-
259
-
260
-
261
-
262
-
263
-
264
-
265
-
266
-
267
-
268
-
269
-
270
-
271
-
272
-
273
-
274
-
275
-
276
-
277
-
278
-
279
-
280
-
281
-
282
 |
 |

49 COMBINED GROUP AND COMPANY MANAGEMENT REPORT
Analysis of the Group Financial Statements
Group Internal Management System
It is an important aspect of corporate culture within the
BMW Group to take account of diverse interests on the
broadest possible basis. This also includes the
require-
ments of capital providers. The value-based management
approach adopted by the BMW Group aims to meet
those requirements. Only companies generating profits
on a sustainable basis that exceed the cost of equity
and debt capital employed are capable of ensuring
con-
tinuous growth, an increase in value for capital providers,
jobs and, in the final analysis, corporate independence.
In this context, the most comprehensive financial indica-
A positive value added means that a company is earning
more than its cost of capital. An increase or decrease in
value added is therefore an important measure of finan-
cial success.
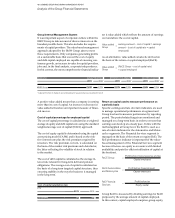
Cost of capital percentage for employed capital
The cost of capital percentage is calculated as a weighted
average of equity and debt capital costs using the standard
weighted average cost of capital (WACC) approach.
The cost of equity capital is determined using the capital
asset pricing model (CAPM) and is based on the
risk-
free interest rate plus the risk premium required by
investors. The risk premium, in turn, is calculated on
the basis of the market risk premium and a beta factor,
the latter reflecting the volatility of stock in relation
to the market.
The cost of debt capital is calculated as the average in-
terest rate relevant for long-term debt and pension
obliga tions. The average cost of capital is calculated on
the basis of a long-term targeted capital structure, thus
ensuring stability in the way the business is managed
in the long term.
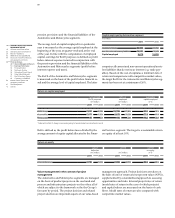
tor is value added which reflects the amount of earnings
over and above the cost of capital.
Value added = earnings amount – cost of capital = earnings
Group amount – (cost of capital rate × capital
employed)
As an alternative, value added can also be derived on
the basis of the return on capital employed (RoCE).
Value added = (RoCE Group – cost of capital rate)
Group × capital employed
Return on capital used to measure performance on
a periodic basis
Specific earnings and rate of return indicators are used
to manage operational performance at segment and
Group level and to measure performance by reporting
period. The period-related targets are monitored and
managed on a long-term basis in order to ensure that
earnings can develop at a steady pace. In line with the
method applied at Group level, the RoCE is used as a
rate of return indicator for the Automotive and
Motor-
cycles segments. The Financial Services segment is
managed on the basis of the return on equity (RoE). The
RoE performance indicator is important for the
value-
based management of the Financial Services segment
because it focuses on equity as a resource with limited
availability and puts the efficient utilisation of capital at
the forefront.
Profit before interest expense and tax
RoCE Group = Capital employed
RoCE Automobiles Profit before financial result
and Motorcycles = Capital employed
RoE Financial Profit before tax
Services = Equity capital
Group RoCE is measured by dividing earnings for RoCE
purposes by the average amount of capital employed.
In this context, capital employed comprises group equity,
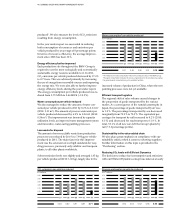
Cost of capital rate (before tax)
in %
2011 2010
BMW Group 12 12
in € million Earnings amount Cost of capital (EC + DC) Value added Group
2011 2010* 2011 2010* 2011 2010*
BMW Group 7,637 5,220 3,575 3,286 4,062 1,934
* Adjusted for effect of change in accounting policy for leased products as described in note 8