BMW 2011 Annual Report Download - page 22
Download and view the complete annual report
Please find page 22 of the 2011 BMW annual report below. You can navigate through the pages in the report by either clicking on the pages listed below, or by using the keyword search tool below to find specific information within the annual report.-
 1
1 -
2
-
3
-
4
-
5
-
6
-
7
-
8
-
9
-
10
-
11
-
 12
12 -
 13
13 -
 14
14 -
 15
15 -
 16
16 -
 17
17 -
 18
18 -
 19
19 -
 20
20 -
 21
21 -
 22
22 -
 23
23 -
 24
24 -
 25
25 -
 26
26 -
 27
27 -
 28
28 -
 29
29 -
 30
30 -
 31
31 -
 32
32 -
33
-
34
-
35
-
36
-
37
-
38
-
39
-
40
-
41
-
42
-
43
-
44
-
45
-
46
-
47
-
48
-
49
-
50
-
51
-
52
-
53
-
54
-
55
-
56
-
57
-
58
-
59
-
60
-
61
-
62
-
63
-
64
-
65
-
66
-
67
-
68
-
69
-
70
-
71
-
72
-
73
-
74
-
75
-
76
-
77
-
78
-
79
-
80
-
81
-
82
-
83
-
84
-
85
-
86
-
87
-
88
-
89
-
90
-
91
-
92
-
93
-
94
-
95
-
96
-
97
-
98
-
99
-
100
-
101
-
102
-
103
-
104
-
105
-
106
-
107
-
108
-
109
-
110
-
111
-
112
-
113
-
114
-
115
-
116
-
117
-
118
-
119
-
120
-
121
-
122
-
123
-
124
-
125
-
126
-
127
-
128
-
129
-
130
-
131
-
132
-
133
-
134
-
135
-
136
-
137
-
138
-
139
-
140
-
141
-
142
-
143
-
144
-
145
-
146
-
147
-
148
-
149
-
150
-
151
-
152
-
153
-
154
-
155
-
156
-
157
-
158
-
159
-
160
-
161
-
162
-
163
-
164
-
165
-
166
-
167
-
168
-
169
-
170
-
171
-
172
-
173
-
174
-
175
-
176
-
177
-
178
-
179
-
180
-
181
-
182
-
183
-
184
-
185
-
186
-
187
-
188
-
189
-
190
-
191
-
192
-
193
-
194
-
195
-
196
-
197
-
198
-
199
-
200
-
201
-
202
-
203
-
204
-
205
-
206
-
207
-
208
-
209
-
210
-
211
-
212
-
213
-
214
-
215
-
216
-
217
-
218
-
219
-
220
-
221
-
222
-
223
-
224
-
225
-
226
-
227
-
228
-
229
-
230
-
231
-
232
-
233
-
234
-
235
-
236
-
237
-
238
-
239
-
240
-
241
-
242
-
243
-
244
-
245
-
246
-
247
-
248
-
249
-
250
-
251
-
252
-
253
-
254
-
255
-
256
-
257
-
258
-
259
-
260
-
261
-
262
-
263
-
264
-
265
-
266
-
267
-
268
-
269
-
270
-
271
-
272
-
273
-
274
-
275
-
276
-
277
-
278
-
279
-
280
-
281
-
282
 |
 |
22
18 COMBINED GROUP AND COMPANY
MANAGEMENT REPORT
18 A Review of the Financial Year
20 General Economic Environment
24 Review of Operations
43 BMW Stock and Capital Market
46 Disclosures relevant for takeovers
and explanatory comments
49 Financial Analysis
49 Internal Management System
51 Earnings Performance
53 Financial Position
56 Net Assets Position
59 Subsequent Events Report
59 Value Added Statement
61 Key Performance Figures
62 Comments on BMW AG
66 Internal Control System and
explanatory comments
67 Risk Management
73 Outlook
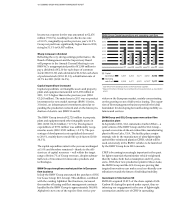
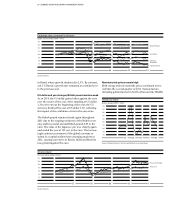
East, served to keep the price of crude oil high (between
US dollar 95 and US dollar 105), despite the deteriorating
economic environment. Metal prices fell by about 25 %
in the second half of 2011 compared to the highs regis-
tered
in the second quarter of 2011, but still remained
high when seen in a long-term comparison.
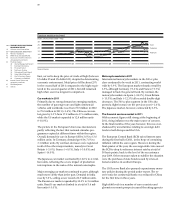
Car markets in 2011
Primarily due to strong demand on emerging markets,
the number of passenger cars and light commercial
vehicles sold worldwide rose from 72.5 million in 2010
to 75.0 million in 2011 (+ 3.4 %). The Chinese car mar-
ket grew by 3.5 % from 17.0 million to 17.6 million units,
while the US market expanded to 12.8 million units
(+ 10.0 %).
The picture in the European Union was inconsistent,
partly reflecting the fact that national stimulus pro-
grammes
expired at different times within the region.
Overall, demand for cars in Europe fell by 3.0 % to 13.0
million units. In Germany, demand grew by 7.0 % to
3.1 million units. By contrast, decreases were registered
in all of the other major markets, namely in Great
Britain (– 5.0 %), France (– 6.0 %), Italy (– 10.0 %) and
Spain (– 16.0 %).
The Japanese car market contracted by 16.0 % to 4.1 mil-
lion units, reflecting the severe impact of production
interruptions in the wake of the natural catastrophe.
Major emerging car markets continued to grow, although
much more slowly than in the past. Demand in India
rose by 7.0 %, setting a new record of 2.9 million units.
The Russian car market expanded by 30.0 % to 2.4 million
units. Brazil’s car market climbed to a total of 3.4 mil-
lion units (+ 3.0 %).
Motorcycle markets in 2011
International motorcycle markets in the 500 cc plus
class continued to be weak in 2011, contracting world-
wide by 3.9 %. The European market shrank overall by
6.9 %, although Germany (+ 3.2 %) and France (+ 3.7 %)
managed to buck the general trend. By contrast, the
motorcycle markets in Spain (– 24.3 %), Great Britain
(– 13.5 %) and Italy (– 12.3 %) all recorded double-digit
decreases. The 500 cc plus segment in the USA also
posted a slight increase on the previous year (+ 1.4 %).
The Japanese market, however, contracted by 6.9 %.
The financial services market in 2011
With economic figures still strong at the beginning of
2011, rising inflation was the main source of concern.
In the final months of the year, however, this was over-
shadowed by uncertainties relating to sovereign debt
levels in both Europe and the USA.
The European Central Bank (ECB) raised interest rates
during the first half of 2011, in the hope of containing
inflation within the euro region. However, during the
final quarter of the year, the sovereign debt crisis caused
the ECB to drop its reference interest rate by a total of
50 basis points, back to the level of the recessionary
year 2009. Other measures taken to stabilise the situation
were the purchase of state bonds issued by crisis-af-
fected countries in southern Europe.
The US Reserve Bank also pursued expansionary mone-
tary policies during the period under report. The re-
serve ratio for commercial banks was reduced in China
for the first time in three years.
High debt levels in a number of euro countries and
gloomier economic prospects caused the rating agencies
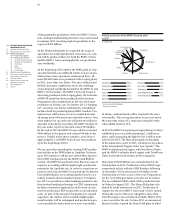
Precious metals price trend
(Index: 29 December 2006 = 100)
300
250
200
150
100
50
07 08 09 10 11
Source: Reuters
Palladium
Gold
Platinum