BMW 2011 Annual Report Download - page 60
Download and view the complete annual report
Please find page 60 of the 2011 BMW annual report below. You can navigate through the pages in the report by either clicking on the pages listed below, or by using the keyword search tool below to find specific information within the annual report.-
 1
1 -
2
-
3
-
4
-
5
-
6
-
7
-
8
-
9
-
10
-
11
-
12
-
13
-
14
-
15
-
16
-
17
-
18
-
19
-
20
-
21
-
22
-
23
-
24
-
25
-
26
-
27
-
28
-
29
-
30
-
31
-
32
-
33
-
34
-
35
-
36
-
37
-
38
-
39
-
40
-
41
-
42
-
43
-
44
-
45
-
46
-
47
-
48
-
49
-
 50
50 -
 51
51 -
 52
52 -
 53
53 -
 54
54 -
 55
55 -
 56
56 -
 57
57 -
 58
58 -
 59
59 -
 60
60 -
 61
61 -
 62
62 -
 63
63 -
 64
64 -
 65
65 -
 66
66 -
 67
67 -
 68
68 -
 69
69 -
 70
70 -
71
-
72
-
73
-
74
-
75
-
76
-
77
-
78
-
79
-
80
-
81
-
82
-
83
-
84
-
85
-
86
-
87
-
88
-
89
-
90
-
91
-
92
-
93
-
94
-
95
-
96
-
97
-
98
-
99
-
100
-
101
-
102
-
103
-
104
-
105
-
106
-
107
-
108
-
109
-
110
-
111
-
112
-
113
-
114
-
115
-
116
-
117
-
118
-
119
-
120
-
121
-
122
-
123
-
124
-
125
-
126
-
127
-
128
-
129
-
130
-
131
-
132
-
133
-
134
-
135
-
136
-
137
-
138
-
139
-
140
-
141
-
142
-
143
-
144
-
145
-
146
-
147
-
148
-
149
-
150
-
151
-
152
-
153
-
154
-
155
-
156
-
157
-
158
-
159
-
160
-
161
-
162
-
163
-
164
-
165
-
166
-
167
-
168
-
169
-
170
-
171
-
172
-
173
-
174
-
175
-
176
-
177
-
178
-
179
-
180
-
181
-
182
-
183
-
184
-
185
-
186
-
187
-
188
-
189
-
190
-
191
-
192
-
193
-
194
-
195
-
196
-
197
-
198
-
199
-
200
-
201
-
202
-
203
-
204
-
205
-
206
-
207
-
208
-
209
-
210
-
211
-
212
-
213
-
214
-
215
-
216
-
217
-
218
-
219
-
220
-
221
-
222
-
223
-
224
-
225
-
226
-
227
-
228
-
229
-
230
-
231
-
232
-
233
-
234
-
235
-
236
-
237
-
238
-
239
-
240
-
241
-
242
-
243
-
244
-
245
-
246
-
247
-
248
-
249
-
250
-
251
-
252
-
253
-
254
-
255
-
256
-
257
-
258
-
259
-
260
-
261
-
262
-
263
-
264
-
265
-
266
-
267
-
268
-
269
-
270
-
271
-
272
-
273
-
274
-
275
-
276
-
277
-
278
-
279
-
280
-
281
-
282
 |
 |

60
18 COMBINED GROUP AND COMPANY
MANAGEMENT REPORT
18 A Review of the Financial Year
20 General Economic Environment
24 Review of Operations
43 BMW Stock and Capital Market
46 Disclosures relevant for takeovers
and explanatory comments
49 Financial Analysis
49 Internal Management System
51 Earnings Performance
53 Financial Position
56 Net Assets Position
59 Subsequent Events Report
59 Value Added Statement
61 Key Performance Figures
62 Comments on BMW AG
66 Internal Control System and
explanatory comments
67 Risk Management
73 Outlook
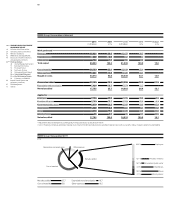
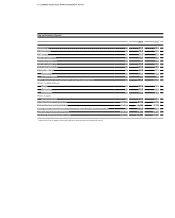
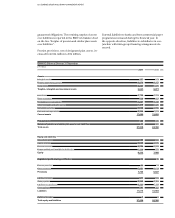
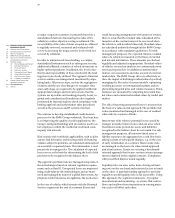
BMW Group Value added statement
2011 2011 20101 2010 Change
in € million in % in € million in % in %
Work performed
Revenues 68,821 99.5 60,477 98.7
Financial income – 400 – 0.6 – 7 –
Other income 782 1.1 766 1.3
Total output 69,203 100.0 61,236 100.0 13.0
Cost of materials2 36,753 53.1 32,108 52.4
Other expenses 7,261 10.5 6,530 10.7
Bought-in costs 44,014 63.6 38,638 63.1 13.9
Gross value added 25,189 36.4 22,598 36.9 11.5
Depreciation and amortisation 7,424 10.7 7,679 12.5
Net value added 17,765 25.7 14,919 24.4 19.1
Applied to
Employees 7,739 43.6 7,278 48.8 6.3
Providers of finance 2,149 12.1 2,363 15.9 – 9.1
Government / public sector 2,970 16.7 2,035 13.6 45.9
Shareholders 1,508 8.5 852 5.7 77.0
Group 3,373 19.0 2,375 15.9 42.0
Minority interest 26 0.1 16 0.1 62.5
Net value added 17,765 100.0 14,919 100.0 19.1
1 Adjusted for effect of change in accounting policy for leased products as described in note 8
2 Cost of materials comprises all primary material costs incurred for vehicle production plus ancillary material costs (such as customs duties, insurance premiums and freight).
BMW Group Value added 2011
in %
Net value added 25.7 Depreciation and amortisation 10.7
Cost of materials 53.1 Other expenses 10.5
Other expenses
Net value added
Cost of materials
Depreciation and amortisation
43.6 % Employees
12.1 % Providers of finance
16.7 % Government / public sector
8.5 % Shareholders
19.0 % Group
0.1 % Minority interest