BMW 2011 Annual Report Download - page 100
Download and view the complete annual report
Please find page 100 of the 2011 BMW annual report below. You can navigate through the pages in the report by either clicking on the pages listed below, or by using the keyword search tool below to find specific information within the annual report.-
 1
1 -
2
-
3
-
4
-
5
-
6
-
7
-
8
-
9
-
10
-
11
-
12
-
13
-
14
-
15
-
16
-
17
-
18
-
19
-
20
-
21
-
22
-
23
-
24
-
25
-
26
-
27
-
28
-
29
-
30
-
31
-
32
-
33
-
34
-
35
-
36
-
37
-
38
-
39
-
40
-
41
-
42
-
43
-
44
-
45
-
46
-
47
-
48
-
49
-
50
-
51
-
52
-
53
-
54
-
55
-
56
-
57
-
58
-
59
-
60
-
61
-
62
-
63
-
64
-
65
-
66
-
67
-
68
-
69
-
70
-
71
-
72
-
73
-
74
-
75
-
76
-
77
-
78
-
79
-
80
-
81
-
82
-
83
-
84
-
85
-
86
-
87
-
88
-
89
-
 90
90 -
 91
91 -
 92
92 -
 93
93 -
 94
94 -
 95
95 -
 96
96 -
 97
97 -
 98
98 -
 99
99 -
 100
100 -
 101
101 -
 102
102 -
 103
103 -
 104
104 -
 105
105 -
 106
106 -
 107
107 -
 108
108 -
 109
109 -
 110
110 -
111
-
112
-
113
-
114
-
115
-
116
-
117
-
118
-
119
-
120
-
121
-
122
-
123
-
124
-
125
-
126
-
127
-
128
-
129
-
130
-
131
-
132
-
133
-
134
-
135
-
136
-
137
-
138
-
139
-
140
-
141
-
142
-
143
-
144
-
145
-
146
-
147
-
148
-
149
-
150
-
151
-
152
-
153
-
154
-
155
-
156
-
157
-
158
-
159
-
160
-
161
-
162
-
163
-
164
-
165
-
166
-
167
-
168
-
169
-
170
-
171
-
172
-
173
-
174
-
175
-
176
-
177
-
178
-
179
-
180
-
181
-
182
-
183
-
184
-
185
-
186
-
187
-
188
-
189
-
190
-
191
-
192
-
193
-
194
-
195
-
196
-
197
-
198
-
199
-
200
-
201
-
202
-
203
-
204
-
205
-
206
-
207
-
208
-
209
-
210
-
211
-
212
-
213
-
214
-
215
-
216
-
217
-
218
-
219
-
220
-
221
-
222
-
223
-
224
-
225
-
226
-
227
-
228
-
229
-
230
-
231
-
232
-
233
-
234
-
235
-
236
-
237
-
238
-
239
-
240
-
241
-
242
-
243
-
244
-
245
-
246
-
247
-
248
-
249
-
250
-
251
-
252
-
253
-
254
-
255
-
256
-
257
-
258
-
259
-
260
-
261
-
262
-
263
-
264
-
265
-
266
-
267
-
268
-
269
-
270
-
271
-
272
-
273
-
274
-
275
-
276
-
277
-
278
-
279
-
280
-
281
-
282
 |
 |
100
76 GROUP FINANCIAL STATEMENTS
76 Income Statements
76 Statement of
Comprehensive Income
78 Balance Sheets
80 Cash Flow Statements
82 Group Statement of Changes
in Equity
84 Notes
84 Accounting Principles
and Policies
100 Notes to the Income
Statement
107 Notes to the Statement
of Comprehensive Income
108
Notes to the Balance Sheet
129 Other Disclosures
145 Segment Information
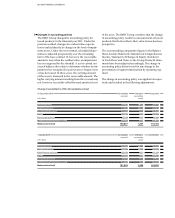
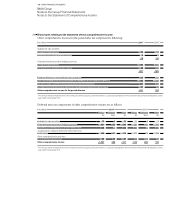
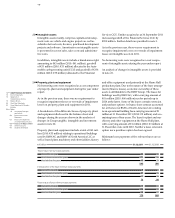
in € million 2011 2010
Sales of products and related goods 52,331 44,838
Income from lease instalments 5,628 5,181
Sale of products previously leased to customers 6,226 6,139
Interest income on loan financing 2,774 2,604
Other income 1,862 1,715
Revenues 68,821 60,477
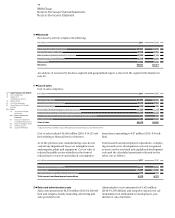
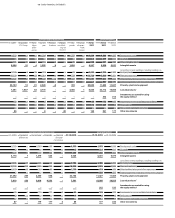
in € million 2011 2010*
Manufacturing costs 33,594 29,156
Research and development costs 3,610 3,082
Warranty expenditure 918 928
Cost of sales directly attributable to financial services 11,723 11,110
Interest expense relating to financial services business 1,914 2,112
Expense for risk provisions and write-downs for financial services business 431 893
Other cost of sales 2,086 2,264
Cost of sales 54,276 49,545
* Adjusted for effect of change in accounting policy for leased products as described in note 8
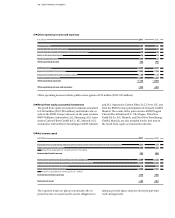
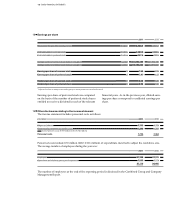
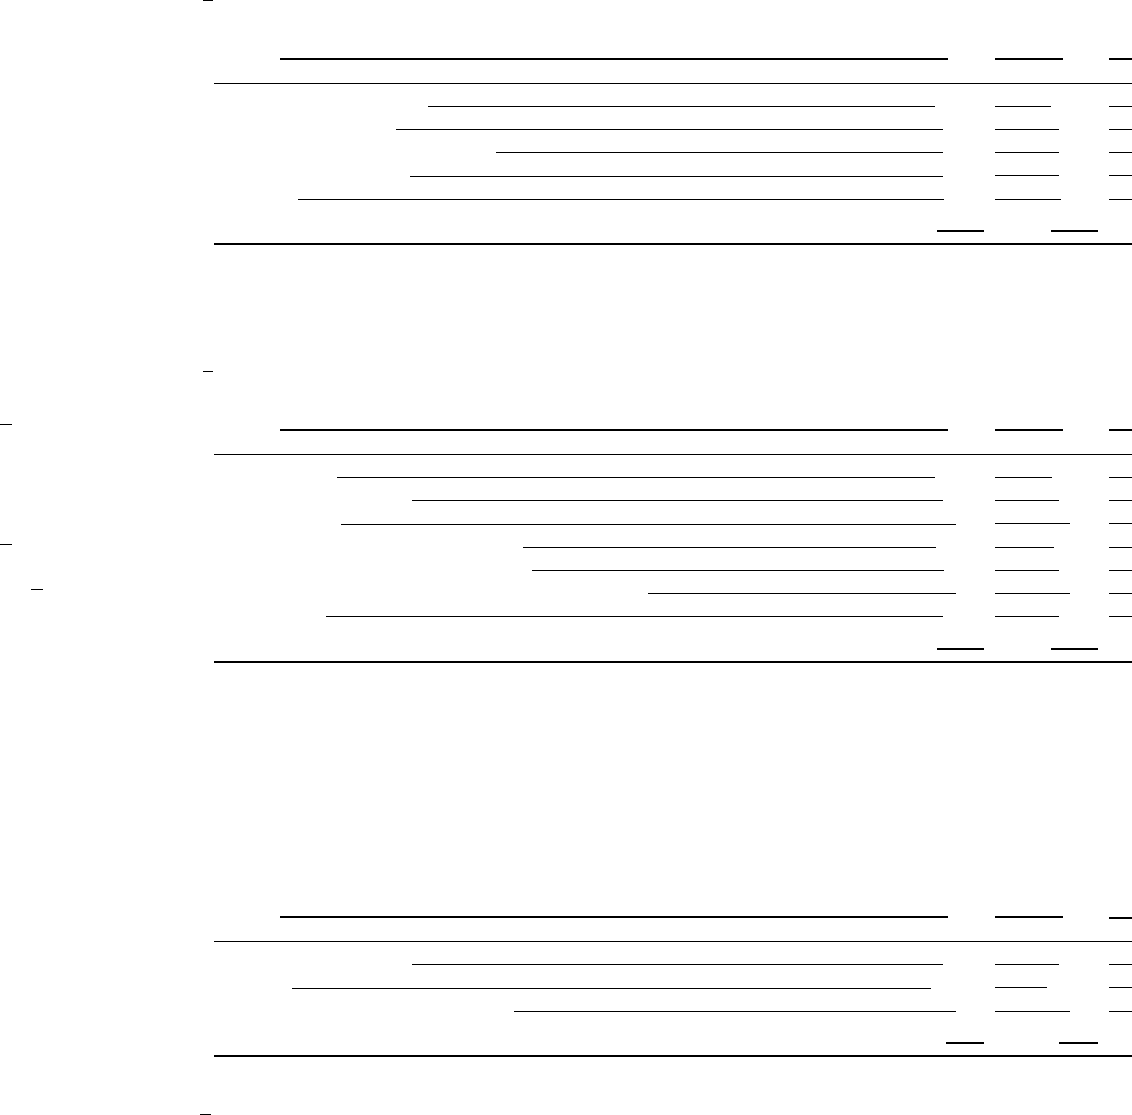
in € million 2011 2010
Research and development costs 3,610 3,082
Amortisation – 1,209 – 1,260
New expenditure for capitalised development costs 972 951
Total research and development expenditure 3,373 2,773
BMW Group
Notes to the Group Financial Statements
Notes to the Income Statement
10
11
Revenues
Revenues by activity comprise the following:
An analysis of revenues by business segment and geographical region is shown in the segment information in
note
49.
12
Cost of sales
Cost of sales comprises:
Cost of sales include € 14,068 million (2010: € 14,115 mil-
lion) relating to financial services business.
As in the previous year, manufacturing costs do not
contain any impairment losses on intangible assets
and property, plant and equipment. Cost of sales is
reduced by public-sector subsidies in the form of
reduced taxes on assets and reduced consumption-
Sales and administrative costs
Sales costs amounted to € 4,554 million (2010: € 4,020 mil-
lion) and comprise mainly marketing, advertising and
sales personnel costs.
based taxes amounting to € 47 million (2010: € 36 mil-
lion).
Total research and development expenditure, compris-
ing research costs, development costs not recognised
as assets on the one hand and capitalised development
costs and the scheduled amortisation thereof on the
other, was as follows:
Administrative costs amounted to € 1,623 million
(2010: € 1,509 million) and comprise expenses for ad-
ministration not attributable to development, pro-
duction or sales functions.