BMW 2011 Annual Report Download - page 102
Download and view the complete annual report
Please find page 102 of the 2011 BMW annual report below. You can navigate through the pages in the report by either clicking on the pages listed below, or by using the keyword search tool below to find specific information within the annual report.-
 1
1 -
2
-
3
-
4
-
5
-
6
-
7
-
8
-
9
-
10
-
11
-
12
-
13
-
14
-
15
-
16
-
17
-
18
-
19
-
20
-
21
-
22
-
23
-
24
-
25
-
26
-
27
-
28
-
29
-
30
-
31
-
32
-
33
-
34
-
35
-
36
-
37
-
38
-
39
-
40
-
41
-
42
-
43
-
44
-
45
-
46
-
47
-
48
-
49
-
50
-
51
-
52
-
53
-
54
-
55
-
56
-
57
-
58
-
59
-
60
-
61
-
62
-
63
-
64
-
65
-
66
-
67
-
68
-
69
-
70
-
71
-
72
-
73
-
74
-
75
-
76
-
77
-
78
-
79
-
80
-
81
-
82
-
83
-
84
-
85
-
86
-
87
-
88
-
89
-
90
-
91
-
 92
92 -
 93
93 -
 94
94 -
 95
95 -
 96
96 -
 97
97 -
 98
98 -
 99
99 -
 100
100 -
 101
101 -
 102
102 -
 103
103 -
 104
104 -
 105
105 -
 106
106 -
 107
107 -
 108
108 -
 109
109 -
 110
110 -
 111
111 -
 112
112 -
113
-
114
-
115
-
116
-
117
-
118
-
119
-
120
-
121
-
122
-
123
-
124
-
125
-
126
-
127
-
128
-
129
-
130
-
131
-
132
-
133
-
134
-
135
-
136
-
137
-
138
-
139
-
140
-
141
-
142
-
143
-
144
-
145
-
146
-
147
-
148
-
149
-
150
-
151
-
152
-
153
-
154
-
155
-
156
-
157
-
158
-
159
-
160
-
161
-
162
-
163
-
164
-
165
-
166
-
167
-
168
-
169
-
170
-
171
-
172
-
173
-
174
-
175
-
176
-
177
-
178
-
179
-
180
-
181
-
182
-
183
-
184
-
185
-
186
-
187
-
188
-
189
-
190
-
191
-
192
-
193
-
194
-
195
-
196
-
197
-
198
-
199
-
200
-
201
-
202
-
203
-
204
-
205
-
206
-
207
-
208
-
209
-
210
-
211
-
212
-
213
-
214
-
215
-
216
-
217
-
218
-
219
-
220
-
221
-
222
-
223
-
224
-
225
-
226
-
227
-
228
-
229
-
230
-
231
-
232
-
233
-
234
-
235
-
236
-
237
-
238
-
239
-
240
-
241
-
242
-
243
-
244
-
245
-
246
-
247
-
248
-
249
-
250
-
251
-
252
-
253
-
254
-
255
-
256
-
257
-
258
-
259
-
260
-
261
-
262
-
263
-
264
-
265
-
266
-
267
-
268
-
269
-
270
-
271
-
272
-
273
-
274
-
275
-
276
-
277
-
278
-
279
-
280
-
281
-
282
 |
 |

102
76 GROUP FINANCIAL STATEMENTS
76 Income Statements
76 Statement of
Comprehensive Income
78 Balance Sheets
80 Cash Flow Statements
82 Group Statement of Changes
in Equity
84 Notes
84 Accounting Principles
and Policies
100 Notes to the Income
Statement
107 Notes to the Statement
of Comprehensive Income
108
Notes to the Balance Sheet
129 Other Disclosures
145 Segment Information
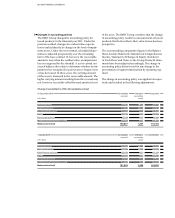
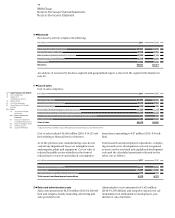
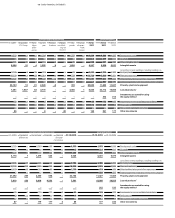
in € million 2011 2010*
Current tax expense 2,868 1,430
Deferred tax income / expense – 392 180
Income taxes 2,476 1,610
* Adjusted for effect of change in accounting policy for leased products as described in note 8
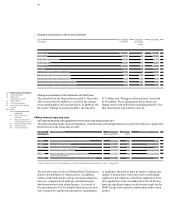
in € million 2011 2010
Income from investments 1 5
thereof from subsidiaries: € 1 million (2010: € 5 million)
Impairment losses on investments in subsidiaries – 8 – 179
Income from reversal of impairment losses on investments in subsidiaries – 3
Result on investments –7 –171
Losses and gains relating to financial instruments – 610 96
Sundry other financial result – 610 96
Other financial result – 617 – 75
17
16
Other financial result
Income taxes
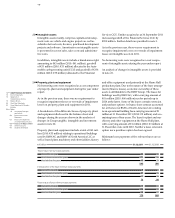
Taxes on income comprise the following:
The result on investments in the financial year 2011 re-
lates mainly to an impairment loss recognised on the
investment in a dealership.
Current tax expense includes € 201 million (2010: € 141
million) relating to prior periods.
Deferred tax income in the financial year 2011 includes
an amount of € 352 million (2010: income of € 204 mil-
lion) arising on new or reversed temporary differences.
Tax expense was reduced by € 12 million (2010: € 7 mil-
lion) as a result of utilising tax losses / tax credits brought
forward for which deferred assets had not previously
been recognised.
The change in the valuation allowance on deferred tax
assets relating to tax losses available for carryforward
and temporary differences resulted in a tax expense of
€ 6 million (2010: income of € 18 million).
Deferred taxes are computed using enacted or planned
tax rates which are expected to apply in the relevant
national jurisdictions when the amounts are recovered.
The negative sundry other financial result was largely
attributable to fair value losses on stand-alone commodity
derivatives and stand-alone interest derivatives.
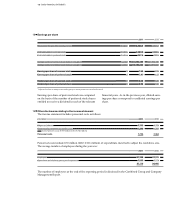
A uniform corporation tax rate of 15.0 % plus solidarity
surcharge of 5.5 % applies in Germany, giving a tax rate
of 15.8 %. After taking account of an average munici-
pal trade tax multiplier rate (Hebesatz) of 420.0 %
(2010: 410.0 %), the municipal trade tax rate for Ger-
man entities is 14.7 % (2010: 14.4 %). The overall in-
come tax rate in Germany is therefore 30.5 % (2010:
30.2 %) Deferred taxes for non-German entities are
calculated on the basis of the relevant country-specific
tax rates and remained in a range of between 12.5 %
and 46.9 %.
Changes in tax rates resulted in a deferred
tax expense of € 36 million in 2011 (2010: € 18 million).
The actual tax expense for the financial year 2011 of
€ 2,476 million (2010: € 1,610 million) is € 224 million (2010:
€ 144 million) higher than the expected tax expense of
€ 2,252 million (2010: € 1,466 million) which would theo-
retically arise if the tax rate of 30.5 % (2010: 30.2 %), ap-
plicable for German companies, was applied across the
Group.