BMW 2011 Annual Report Download - page 80
Download and view the complete annual report
Please find page 80 of the 2011 BMW annual report below. You can navigate through the pages in the report by either clicking on the pages listed below, or by using the keyword search tool below to find specific information within the annual report.-
 1
1 -
2
-
3
-
4
-
5
-
6
-
7
-
8
-
9
-
10
-
11
-
12
-
13
-
14
-
15
-
16
-
17
-
18
-
19
-
20
-
21
-
22
-
23
-
24
-
25
-
26
-
27
-
28
-
29
-
30
-
31
-
32
-
33
-
34
-
35
-
36
-
37
-
38
-
39
-
40
-
41
-
42
-
43
-
44
-
45
-
46
-
47
-
48
-
49
-
50
-
51
-
52
-
53
-
54
-
55
-
56
-
57
-
58
-
59
-
60
-
61
-
62
-
63
-
64
-
65
-
66
-
67
-
68
-
69
-
 70
70 -
 71
71 -
 72
72 -
 73
73 -
 74
74 -
 75
75 -
 76
76 -
 77
77 -
 78
78 -
 79
79 -
 80
80 -
 81
81 -
 82
82 -
 83
83 -
 84
84 -
 85
85 -
 86
86 -
 87
87 -
 88
88 -
 89
89 -
 90
90 -
91
-
92
-
93
-
94
-
95
-
96
-
97
-
98
-
99
-
100
-
101
-
102
-
103
-
104
-
105
-
106
-
107
-
108
-
109
-
110
-
111
-
112
-
113
-
114
-
115
-
116
-
117
-
118
-
119
-
120
-
121
-
122
-
123
-
124
-
125
-
126
-
127
-
128
-
129
-
130
-
131
-
132
-
133
-
134
-
135
-
136
-
137
-
138
-
139
-
140
-
141
-
142
-
143
-
144
-
145
-
146
-
147
-
148
-
149
-
150
-
151
-
152
-
153
-
154
-
155
-
156
-
157
-
158
-
159
-
160
-
161
-
162
-
163
-
164
-
165
-
166
-
167
-
168
-
169
-
170
-
171
-
172
-
173
-
174
-
175
-
176
-
177
-
178
-
179
-
180
-
181
-
182
-
183
-
184
-
185
-
186
-
187
-
188
-
189
-
190
-
191
-
192
-
193
-
194
-
195
-
196
-
197
-
198
-
199
-
200
-
201
-
202
-
203
-
204
-
205
-
206
-
207
-
208
-
209
-
210
-
211
-
212
-
213
-
214
-
215
-
216
-
217
-
218
-
219
-
220
-
221
-
222
-
223
-
224
-
225
-
226
-
227
-
228
-
229
-
230
-
231
-
232
-
233
-
234
-
235
-
236
-
237
-
238
-
239
-
240
-
241
-
242
-
243
-
244
-
245
-
246
-
247
-
248
-
249
-
250
-
251
-
252
-
253
-
254
-
255
-
256
-
257
-
258
-
259
-
260
-
261
-
262
-
263
-
264
-
265
-
266
-
267
-
268
-
269
-
270
-
271
-
272
-
273
-
274
-
275
-
276
-
277
-
278
-
279
-
280
-
281
-
282
 |
 |

80
76 GROUP FINANCIAL STATEMENTS
76 Income Statements
76 Statement of
Comprehensive Income
78 Balance Sheets
80 Cash Flow Statements
82 Group Statement of Changes
in Equity
84 Notes
84 Accounting Principles
and Policies
100 Notes to the Income
Statement
107 Notes to the Statement
of Comprehensive Income
108
Notes to the Balance Sheet
129 Other Disclosures
145 Segment Information
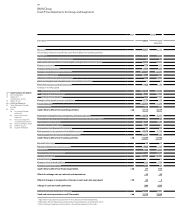
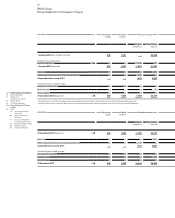
BMW Group
Cash Flow Statements for Group and Segments
Note Group
in € million 2011 20101, 2
(adjusted)
Net profit 4,907 3,243
Reconciliation between net profit and cash inflow / outflow from operating activities
Current tax 2,868 1,430
Other interest and similar income / expenses 1 42
Depreciation and amortisation of other tangible, intangible and investment assets 3,654 3,861
Change in provisions 779 911
Change in leased products – 379 888
Change in receivables from sales financing – 2,837 – 4,616
Change in deferred taxes – 338 348
Other non-cash income and expense items 148 – 694
Gain / loss of tangible and intangible assets and marketable securities – 5
Result from equity accounted investments – 162 – 98
Changes in working capital
Change in inventories – 1,715 – 1,170
Change in trade receivables – 800 – 427
Change in trade payables 900 1,194
Change in other operating assets and liabilities 1,175 572
Income taxes paid – 2,701 – 1,318
Interest received 213 148
Cash inf low / outflow from operating activities 43
5,713 4,319
Investment in intangible assets and property, plant and equipment – 3,679 – 3,263
Proceeds from the disposal of intangible assets and property, plant and equipment 53 55
Expenditure for investments – 543 – 80
Net cash in acquiring ICL Group – 595 –
Proceeds from the disposal of investments 21 23
Cash payments for the purchase of marketable securities – 2,073 – 2,723
Cash proceeds from the sale of marketable securities 1,317 798
Cash inf low / outflow from investing activities 43
– 5,499 – 5,190
Payments into equity 16 18
Payment of dividend for the previous year – 852 – 197
Interest paid – 82 – 223
Proceeds from the issue of bonds 5,899 4,578
Repayment of bonds – 5,333 – 3,406
Internal financing – –
Change in other financial liabilities 191 – 292
Change in commercial paper 248 32
Cash inf low / outflow from f inancing activities 43
87 510
Effect of exchange rate on cash and cash equivalents – 13 22
Effect of changes in composition of Group on cash and cash equivalents 43
56 4
Change in cash and cash equivalents 344 – 335
Cash and cash equivalents as at 1 January 7,432 7,767
Cash and cash equivalents as at 31 December 43
7,776 7,432
1 Adjusted for reclassification described in note 43 to the Group Financial Statements.
2 Adjusted for effect of change in accounting policy for leased products as described in note 8
3 Interest relating to financial services business is classified as revenues / cost of sales.