BMW 2011 Annual Report Download - page 41
Download and view the complete annual report
Please find page 41 of the 2011 BMW annual report below. You can navigate through the pages in the report by either clicking on the pages listed below, or by using the keyword search tool below to find specific information within the annual report.
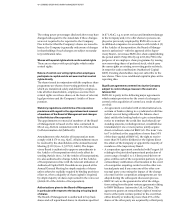
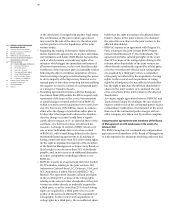
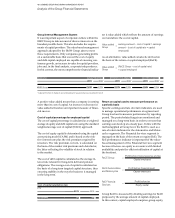
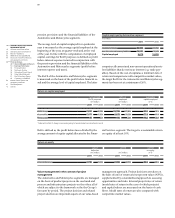
41 COMBINED GROUP AND COMPANY MANAGEMENT REPORT
produced". We also measure the level of CO2 emissions
resulting from energy consumption.
In the year under report we succeeded in reducing
both consumption of resources and emissions per
vehicle produced by an average of 8 percentage points.
In terms of resource efficiency, the average improve-
ment since 2006 has been 32 %.
Energy efficiency further improved
Each production site throughout the BMW Group is
required to use the most ecologically and economically
sustainable energy resource available to it. In 2011,
CO
2
emissions per vehicle produced decreased by 17.4 %
to 0.71 tons. This was achieved primarily by increasing
the use of energy from renewable sources and improving
the energy mix. We were also able to further improve
energy efficiency levels during the
year under report.
The energy consumption per vehicle produced was re-
duced from 2.75 MWh to 2.46 MWh (– 10.5 %).
Water consumption per vehicle reduced
We also managed to reduce the amount of water con-
sumed per vehicle produced in 2011 by 8.2 % to 2.12 m³
(2010: 2.31 m³). The amount of process wastewater per
vehicle produced decreased by 6.9 % to 0.54 m³ (2010:
0.58 m³). The improvement was favoured by capacity
utilisation levels, an improved water management system
and innovative, water-saving painting processes.
Less waste for disposal
The amount of non-recyclable waste from production
processes was reduced by 20.8 % to 7.99 kg per vehicle
produced in 2011. The main factor for this improve-
ment
was the extension of our high standards for recy-
cling processes, previously only valid for our European
plants, to all other plants worldwide.
Solvent emission levels rose slightly and averaged 1.65 kg
per vehicle produced (2010: 1.60 kg), largely due to the
increased volume of production in China, where the new
painting processes were not yet available.
Efficient transport logistics
The regional shift of sales volume caused changes in
the proportion of goods transported by the various
modes. As a consequence of the natural catastrophe in
Japan, the percentage of goods transported by air rose
to 1.0 %.
The percentage transported by sea decreased
marginally from 79.9 % to 78.9 %. The equivalent per-
centages for transport
by rail increased to 8.2 % (2010:
6.3 %) and decreased
for road transport to 11.9 %. In
total, 53.1 % of all new cars left the Group's plants by
rail (+ 3.6 percentage points).
Sustainability in the value-added chain
We also place great emphasis on compliance with sus-
tainability criteria when it comes to selecting suppliers.
Further information on this topic is provided in the
“Purchasing” section.
Reducing CO2 levels with Efficient Dynamics
The decision to reduce fuel consumption and emissions
with our Efficient Dynamics concept was taken at an early
CO2 emissions per vehicle produced
in t / vehicle
0.95
0.90
0.85
0.80
0.75
0.70
07 08 09 10 11
0.84 0.82 0.91 0.86 0.71
Water consumption* per vehicle produced
in m3 / vehicle
2.80
2.60
2.40
2.20
2.00
1.80
07 08 09 10 11
2.61 2.56 2.56 2.31 2.12
*
The indicators for water consumption refer to the production sites of the BMW Group.
The water consumption includes the process water input for the production as well as
the general water consumption e. g. for sanitation facilities.
Process wastewater per vehicle produced
in m3 / vehicle
0.70
0.60
0.50
0.40
0.30
0.20
07 08 09 10 11
0.64 0.64 0.62 0.58 0.54


