BMW 2011 Annual Report Download - page 87
Download and view the complete annual report
Please find page 87 of the 2011 BMW annual report below. You can navigate through the pages in the report by either clicking on the pages listed below, or by using the keyword search tool below to find specific information within the annual report.-
 1
1 -
2
-
3
-
4
-
5
-
6
-
7
-
8
-
9
-
10
-
11
-
12
-
13
-
14
-
15
-
16
-
17
-
18
-
19
-
20
-
21
-
22
-
23
-
24
-
25
-
26
-
27
-
28
-
29
-
30
-
31
-
32
-
33
-
34
-
35
-
36
-
37
-
38
-
39
-
40
-
41
-
42
-
43
-
44
-
45
-
46
-
47
-
48
-
49
-
50
-
51
-
52
-
53
-
54
-
55
-
56
-
57
-
58
-
59
-
60
-
61
-
62
-
63
-
64
-
65
-
66
-
67
-
68
-
69
-
70
-
71
-
72
-
73
-
74
-
75
-
76
-
 77
77 -
 78
78 -
 79
79 -
 80
80 -
 81
81 -
 82
82 -
 83
83 -
 84
84 -
 85
85 -
 86
86 -
 87
87 -
 88
88 -
 89
89 -
 90
90 -
 91
91 -
 92
92 -
 93
93 -
 94
94 -
 95
95 -
 96
96 -
 97
97 -
98
-
99
-
100
-
101
-
102
-
103
-
104
-
105
-
106
-
107
-
108
-
109
-
110
-
111
-
112
-
113
-
114
-
115
-
116
-
117
-
118
-
119
-
120
-
121
-
122
-
123
-
124
-
125
-
126
-
127
-
128
-
129
-
130
-
131
-
132
-
133
-
134
-
135
-
136
-
137
-
138
-
139
-
140
-
141
-
142
-
143
-
144
-
145
-
146
-
147
-
148
-
149
-
150
-
151
-
152
-
153
-
154
-
155
-
156
-
157
-
158
-
159
-
160
-
161
-
162
-
163
-
164
-
165
-
166
-
167
-
168
-
169
-
170
-
171
-
172
-
173
-
174
-
175
-
176
-
177
-
178
-
179
-
180
-
181
-
182
-
183
-
184
-
185
-
186
-
187
-
188
-
189
-
190
-
191
-
192
-
193
-
194
-
195
-
196
-
197
-
198
-
199
-
200
-
201
-
202
-
203
-
204
-
205
-
206
-
207
-
208
-
209
-
210
-
211
-
212
-
213
-
214
-
215
-
216
-
217
-
218
-
219
-
220
-
221
-
222
-
223
-
224
-
225
-
226
-
227
-
228
-
229
-
230
-
231
-
232
-
233
-
234
-
235
-
236
-
237
-
238
-
239
-
240
-
241
-
242
-
243
-
244
-
245
-
246
-
247
-
248
-
249
-
250
-
251
-
252
-
253
-
254
-
255
-
256
-
257
-
258
-
259
-
260
-
261
-
262
-
263
-
264
-
265
-
266
-
267
-
268
-
269
-
270
-
271
-
272
-
273
-
274
-
275
-
276
-
277
-
278
-
279
-
280
-
281
-
282
 |
 |

87 GROUP FINANCIAL STATEMENTS
were allocated to assets and liabilities as initial carrying
amounts on first-time consolidation at 30 September
The fair value of receivables from sales financing
amounted to € 229 million, comprising a gross amount
of € 236 million and an allowance of € 7 million.
Goodwill was allocated in full to the Financial Services
segment. The amount recognised as goodwill is not tax
deductible.
Customer bases and order books acquired at the time of
the share deal were recognised as intangible assets.
The contract portfolio relating to leased products was
measured at its fair value.
Transaction costs of € 8 million were recognised as ex-
pense and reported in other operating expenses.
2011 and in the Group Financial Statements for the year
ended 31 December 2011:
The remainder of the surplus (€ 258 million) of acquisi-
tion cost over the fair value of the identifiable net assets
acquired is largely attributable to potential synergy
benefits which will arise from the future growth of the
Group’s fleet business.
Up to the end of the third quarter 2011, the acquired
entities generated an after-tax profit of € 61 million
on revenues of € 1,549 million. Post-acquisition, they
recorded a post-tax loss of € 27 million on revenues
of € 501 million.
There were no acquisitions in 2010.
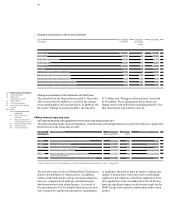
4
Consolidation principles
The equity of subsidiaries is consolidated in accordance
with IFRS 3 (Business Combinations). IFRS 3 requires
that all business combinations are accounted for using
the acquisition method, whereby identifiable assets and
liabilities acquired are measured at their fair value at
acquisition date. An excess of acquisition cost over the
Group’s share of the net fair value of identifiable assets,
liabilities and contingent liabilities is recognised as good-
will as a separate balance sheet line item and allocated
to the relevant cash-generating unit (CGU). Goodwill of
€ 91 million which arose prior to 1 January 1995 remains
netted against reserves.
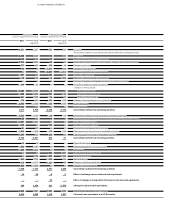
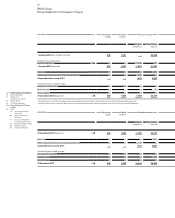
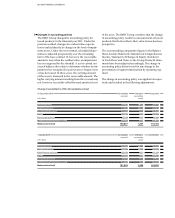
Fair values
at 30 September 2011
in € million Provisional amounts at Definitive amounts at
30 September 2011 31 December 2011
Assets
Intangible assets 81 143
Property, plant and equipment 23 23
Leased products 3,620 3,385
Receivables from sales financing 138 229
Deferred tax 67 57
Other assets 235 249
Payables and provisions
Other provisions 3 29
Deferred tax liabilities 155 108
Financial liabilities 3,181 3,203
Trade payables 109 71
Current tax 40 31
Other liabilities 188 203
Net assets acquired 488 441
Cost 696 699
Goodwill 208 258