BMW 2011 Annual Report Download - page 19
Download and view the complete annual report
Please find page 19 of the 2011 BMW annual report below. You can navigate through the pages in the report by either clicking on the pages listed below, or by using the keyword search tool below to find specific information within the annual report.-
 1
1 -
2
-
3
-
4
-
5
-
6
-
7
-
8
-
 9
9 -
 10
10 -
 11
11 -
 12
12 -
 13
13 -
 14
14 -
 15
15 -
 16
16 -
 17
17 -
 18
18 -
 19
19 -
 20
20 -
 21
21 -
 22
22 -
 23
23 -
 24
24 -
 25
25 -
 26
26 -
 27
27 -
 28
28 -
 29
29 -
30
-
31
-
32
-
33
-
34
-
35
-
36
-
37
-
38
-
39
-
40
-
41
-
42
-
43
-
44
-
45
-
46
-
47
-
48
-
49
-
50
-
51
-
52
-
53
-
54
-
55
-
56
-
57
-
58
-
59
-
60
-
61
-
62
-
63
-
64
-
65
-
66
-
67
-
68
-
69
-
70
-
71
-
72
-
73
-
74
-
75
-
76
-
77
-
78
-
79
-
80
-
81
-
82
-
83
-
84
-
85
-
86
-
87
-
88
-
89
-
90
-
91
-
92
-
93
-
94
-
95
-
96
-
97
-
98
-
99
-
100
-
101
-
102
-
103
-
104
-
105
-
106
-
107
-
108
-
109
-
110
-
111
-
112
-
113
-
114
-
115
-
116
-
117
-
118
-
119
-
120
-
121
-
122
-
123
-
124
-
125
-
126
-
127
-
128
-
129
-
130
-
131
-
132
-
133
-
134
-
135
-
136
-
137
-
138
-
139
-
140
-
141
-
142
-
143
-
144
-
145
-
146
-
147
-
148
-
149
-
150
-
151
-
152
-
153
-
154
-
155
-
156
-
157
-
158
-
159
-
160
-
161
-
162
-
163
-
164
-
165
-
166
-
167
-
168
-
169
-
170
-
171
-
172
-
173
-
174
-
175
-
176
-
177
-
178
-
179
-
180
-
181
-
182
-
183
-
184
-
185
-
186
-
187
-
188
-
189
-
190
-
191
-
192
-
193
-
194
-
195
-
196
-
197
-
198
-
199
-
200
-
201
-
202
-
203
-
204
-
205
-
206
-
207
-
208
-
209
-
210
-
211
-
212
-
213
-
214
-
215
-
216
-
217
-
218
-
219
-
220
-
221
-
222
-
223
-
224
-
225
-
226
-
227
-
228
-
229
-
230
-
231
-
232
-
233
-
234
-
235
-
236
-
237
-
238
-
239
-
240
-
241
-
242
-
243
-
244
-
245
-
246
-
247
-
248
-
249
-
250
-
251
-
252
-
253
-
254
-
255
-
256
-
257
-
258
-
259
-
260
-
261
-
262
-
263
-
264
-
265
-
266
-
267
-
268
-
269
-
270
-
271
-
272
-
273
-
274
-
275
-
276
-
277
-
278
-
279
-
280
-
281
-
282
 |
 |

19 COMBINED GROUP AND COMPANY MANAGEMENT REPORT
Income tax expense for the year amounted to € 2,476
million (+ 53.8 %), resulting in an effective tax rate
of 33.5 %, marginally up on the previous year’s 33.2 %.
Group net profit was significantly higher than in 2010,
rising by 51.3 % to € 4,907 million.
Sharp increase in dividend
Reflecting the very strong earnings performance, the
Board of Management and the Supervisory Board
will propose to the Annual General Meeting to use
BMW AG’s unappropriated profit of € 1,508 million to
pay a dividend of € 2.30 for each share of common
stock (2010: € 1.30) and a dividend of € 2.32 for each share
of preferred stock (2010: € 1.32), a distribution rate of
30.7 % for 2011 (2010: 26.5 %).
Capital expenditure increased
Capital expenditure on intangible assets and property,
plant and equipment amounted to € 3,692 million in
2011, 13.1 % higher than in the previous year (2010:
€ 3,263 million). The main focus in 2011 was on product
investments for new model start-ups (BMW 1 Series,
3 Series), on infrastructure investments aimed at ex-
panding the production network and on the future pro-
duction of electric cars (BMW i 3 and i8).
The BMW Group invested € 2,720 million in property,
plant and equipment and other intangible assets in
2011 (2010: € 2,312 million; + 17.6 %). Development
expenditure of € 972 million was additionally recog-
nised
as assets (2010: € 951 million; + 2.2 %). The per-
centage of development costs capitalised decreased
to 28.8 %, mainly due to model life cycle factors (2010:
34.3 %).
The capital expenditure ratio for the year was unchanged
at 5.4 % and therefore remained – thanks to the effi-
cient use of capital resources – well within the target
range of below 7 % of Group revenues, despite substan-
tial levels of investment in innovative products and
technologies.
BMW Group strengthens market position in European
fleet business
In July the BMW Group announced the purchase of ING
Car Lease Group (ICL Group). This addition, combined
with the existing Alphabet fleet business, increased
the number of leasing and fleet management contracts
handled by the BMW
Group to approximately 540,000.
Alphabet is now one of the top five fleet service pro-
viders
on the European
market, mainly concentrating
on the growing sector of full-service leasing. The expan-
sion of fleet management business provides the ideal
foundation for developing forward-looking mobility so-
lutions and services.
BMW Group and SGL Group open new carbon fibre
production plant
In September 2011, SGL Automotive Carbon Fibers – a
joint venture of the BMW Group and the SGL Group –
opened a new state-of-the-art carbon fibre manufacturing
plant in Moses Lake, USA. The facility plays a major
strategic role in the manufacture of ultra-lightweight
carbon-fibre reinforced plastics (CFRP), which will be
used extensively in the BMW i vehicles to be launched
by the BMW Group from 2013 onwards.
CFRP is becoming increasingly important in the quest
for lighter materials that minimise vehicle weight and
thereby reduce both fuel consumption and CO2 emis-
sions. With their new production plant in Moses Lake,
the
BMW Group and
the
SGL Group are proving that
targeted
innovations can make a real eco-friendly con-
tribution towards the
future of individual mobility.
Investment in SGL Carbon SE
BMW AG acquired 15.81 % of the share capital of SGL
Carbon SE during the period under report, thus re-
inforcing
our engagement in the area of lightweight
construction and the use of CFRP in carmaking.
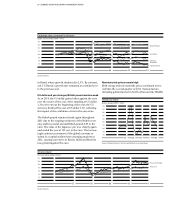
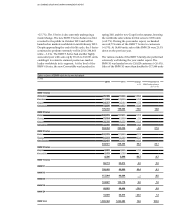
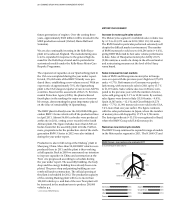
BMW Group Capital expenditure and operating cash flow
in € million
8,000
7,000
6,000
5,000
4,000
3,000
2,000
07 08 09 10 11
Capital
expenditure 4,267 4,204 3,471 3,263 3,692
Operating
cash flow1 6,246 4,471 4,921 8,1492 7,077
1 Cash inflow from operating activities of the Automotive segment
2 Adjusted for effect of change in accounting policy for leased products as described in
note 8