BMW 2011 Annual Report Download - page 105
Download and view the complete annual report
Please find page 105 of the 2011 BMW annual report below. You can navigate through the pages in the report by either clicking on the pages listed below, or by using the keyword search tool below to find specific information within the annual report.-
 1
1 -
2
-
3
-
4
-
5
-
6
-
7
-
8
-
9
-
10
-
11
-
12
-
13
-
14
-
15
-
16
-
17
-
18
-
19
-
20
-
21
-
22
-
23
-
24
-
25
-
26
-
27
-
28
-
29
-
30
-
31
-
32
-
33
-
34
-
35
-
36
-
37
-
38
-
39
-
40
-
41
-
42
-
43
-
44
-
45
-
46
-
47
-
48
-
49
-
50
-
51
-
52
-
53
-
54
-
55
-
56
-
57
-
58
-
59
-
60
-
61
-
62
-
63
-
64
-
65
-
66
-
67
-
68
-
69
-
70
-
71
-
72
-
73
-
74
-
75
-
76
-
77
-
78
-
79
-
80
-
81
-
82
-
83
-
84
-
85
-
86
-
87
-
88
-
89
-
90
-
91
-
92
-
93
-
94
-
 95
95 -
 96
96 -
 97
97 -
 98
98 -
 99
99 -
 100
100 -
 101
101 -
 102
102 -
 103
103 -
 104
104 -
 105
105 -
 106
106 -
 107
107 -
 108
108 -
 109
109 -
 110
110 -
 111
111 -
 112
112 -
 113
113 -
 114
114 -
 115
115 -
116
-
117
-
118
-
119
-
120
-
121
-
122
-
123
-
124
-
125
-
126
-
127
-
128
-
129
-
130
-
131
-
132
-
133
-
134
-
135
-
136
-
137
-
138
-
139
-
140
-
141
-
142
-
143
-
144
-
145
-
146
-
147
-
148
-
149
-
150
-
151
-
152
-
153
-
154
-
155
-
156
-
157
-
158
-
159
-
160
-
161
-
162
-
163
-
164
-
165
-
166
-
167
-
168
-
169
-
170
-
171
-
172
-
173
-
174
-
175
-
176
-
177
-
178
-
179
-
180
-
181
-
182
-
183
-
184
-
185
-
186
-
187
-
188
-
189
-
190
-
191
-
192
-
193
-
194
-
195
-
196
-
197
-
198
-
199
-
200
-
201
-
202
-
203
-
204
-
205
-
206
-
207
-
208
-
209
-
210
-
211
-
212
-
213
-
214
-
215
-
216
-
217
-
218
-
219
-
220
-
221
-
222
-
223
-
224
-
225
-
226
-
227
-
228
-
229
-
230
-
231
-
232
-
233
-
234
-
235
-
236
-
237
-
238
-
239
-
240
-
241
-
242
-
243
-
244
-
245
-
246
-
247
-
248
-
249
-
250
-
251
-
252
-
253
-
254
-
255
-
256
-
257
-
258
-
259
-
260
-
261
-
262
-
263
-
264
-
265
-
266
-
267
-
268
-
269
-
270
-
271
-
272
-
273
-
274
-
275
-
276
-
277
-
278
-
279
-
280
-
281
-
282
 |
 |

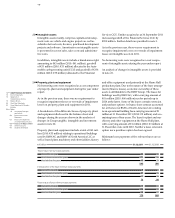
105 GROUP FINANCIAL STATEMENTS
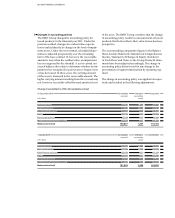
2011 2010*
Net profit for the year after minority interest € million 4,880.9 3,227.2
Profit attributable to common stock € million 4,483.9 2,966.6
Profit attributable to preferred stock € million 397.0 260.6
Average number of common stock shares in circulation number 601,995,196 601,995,196
Average number of preferred stock shares in circulation number 53,163,232 52,663,822
Earnings per share of common stock € 7.45 4.93
Earnings per share of preferred stock € 7.47 4.95
Dividend per share of common stock € 2.30 1.30
Dividend per share of preferred stock € 2.32 1.32
* Adjusted for effect of change in accounting policy for leased products as described in note 8
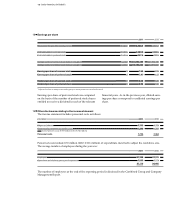
Earnings per share
18
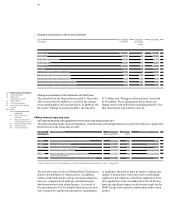
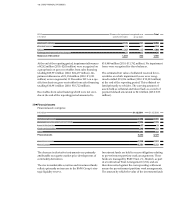
Personnel costs include € 70 million (2010: € 116 million) of expenditure incurred to adjust the workforce size.
The average number of employees during the year was:
Earnings per share of preferred stock are computed
on the basis of the number of preferred stock shares
entitled to receive a dividend in each of the relevant
The number of employees at the end of the reporting period is disclosed in the Combined Group and Company
Management Report.
Other disclosures relating to the income statement
The income statement includes personnel costs as follows:
financial years. As in the previous year, diluted earn-
ings per share correspond to undiluted earnings per
share.
2011 2010
Employees 91,168 88,933
Apprentices and students gaining work experience 5,942 5,513
97,110 94,446
in € million 2011 2010
Wages and salaries 6,399 6,109
Social security, retirement and welfare costs 1,340 1,285
thereof pension costs: € 789 million (2010: € 740 million)
Personnel costs 7,739 7,394
19