BMW 2011 Annual Report Download - page 108
Download and view the complete annual report
Please find page 108 of the 2011 BMW annual report below. You can navigate through the pages in the report by either clicking on the pages listed below, or by using the keyword search tool below to find specific information within the annual report.-
 1
1 -
2
-
3
-
4
-
5
-
6
-
7
-
8
-
9
-
10
-
11
-
12
-
13
-
14
-
15
-
16
-
17
-
18
-
19
-
20
-
21
-
22
-
23
-
24
-
25
-
26
-
27
-
28
-
29
-
30
-
31
-
32
-
33
-
34
-
35
-
36
-
37
-
38
-
39
-
40
-
41
-
42
-
43
-
44
-
45
-
46
-
47
-
48
-
49
-
50
-
51
-
52
-
53
-
54
-
55
-
56
-
57
-
58
-
59
-
60
-
61
-
62
-
63
-
64
-
65
-
66
-
67
-
68
-
69
-
70
-
71
-
72
-
73
-
74
-
75
-
76
-
77
-
78
-
79
-
80
-
81
-
82
-
83
-
84
-
85
-
86
-
87
-
88
-
89
-
90
-
91
-
92
-
93
-
94
-
95
-
96
-
97
-
 98
98 -
 99
99 -
 100
100 -
 101
101 -
 102
102 -
 103
103 -
 104
104 -
 105
105 -
 106
106 -
 107
107 -
 108
108 -
 109
109 -
 110
110 -
 111
111 -
 112
112 -
 113
113 -
 114
114 -
 115
115 -
 116
116 -
 117
117 -
 118
118 -
119
-
120
-
121
-
122
-
123
-
124
-
125
-
126
-
127
-
128
-
129
-
130
-
131
-
132
-
133
-
134
-
135
-
136
-
137
-
138
-
139
-
140
-
141
-
142
-
143
-
144
-
145
-
146
-
147
-
148
-
149
-
150
-
151
-
152
-
153
-
154
-
155
-
156
-
157
-
158
-
159
-
160
-
161
-
162
-
163
-
164
-
165
-
166
-
167
-
168
-
169
-
170
-
171
-
172
-
173
-
174
-
175
-
176
-
177
-
178
-
179
-
180
-
181
-
182
-
183
-
184
-
185
-
186
-
187
-
188
-
189
-
190
-
191
-
192
-
193
-
194
-
195
-
196
-
197
-
198
-
199
-
200
-
201
-
202
-
203
-
204
-
205
-
206
-
207
-
208
-
209
-
210
-
211
-
212
-
213
-
214
-
215
-
216
-
217
-
218
-
219
-
220
-
221
-
222
-
223
-
224
-
225
-
226
-
227
-
228
-
229
-
230
-
231
-
232
-
233
-
234
-
235
-
236
-
237
-
238
-
239
-
240
-
241
-
242
-
243
-
244
-
245
-
246
-
247
-
248
-
249
-
250
-
251
-
252
-
253
-
254
-
255
-
256
-
257
-
258
-
259
-
260
-
261
-
262
-
263
-
264
-
265
-
266
-
267
-
268
-
269
-
270
-
271
-
272
-
273
-
274
-
275
-
276
-
277
-
278
-
279
-
280
-
281
-
282
 |
 |
108
76 GROUP FINANCIAL STATEMENTS
76 Income Statements
76 Statement of
Comprehensive Income
78 Balance Sheets
80 Cash Flow Statements
82 Group Statement of Changes
in Equity
84 Notes
84 Accounting Principles
and Policies
100 Notes to the Income
Statement
107 Notes to the Statement
of Comprehensive Income
108
Notes to the Balance Sheet
129 Other Disclosures
145 Segment Information
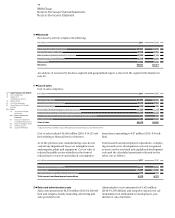
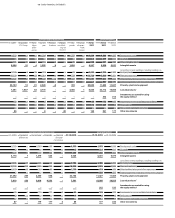
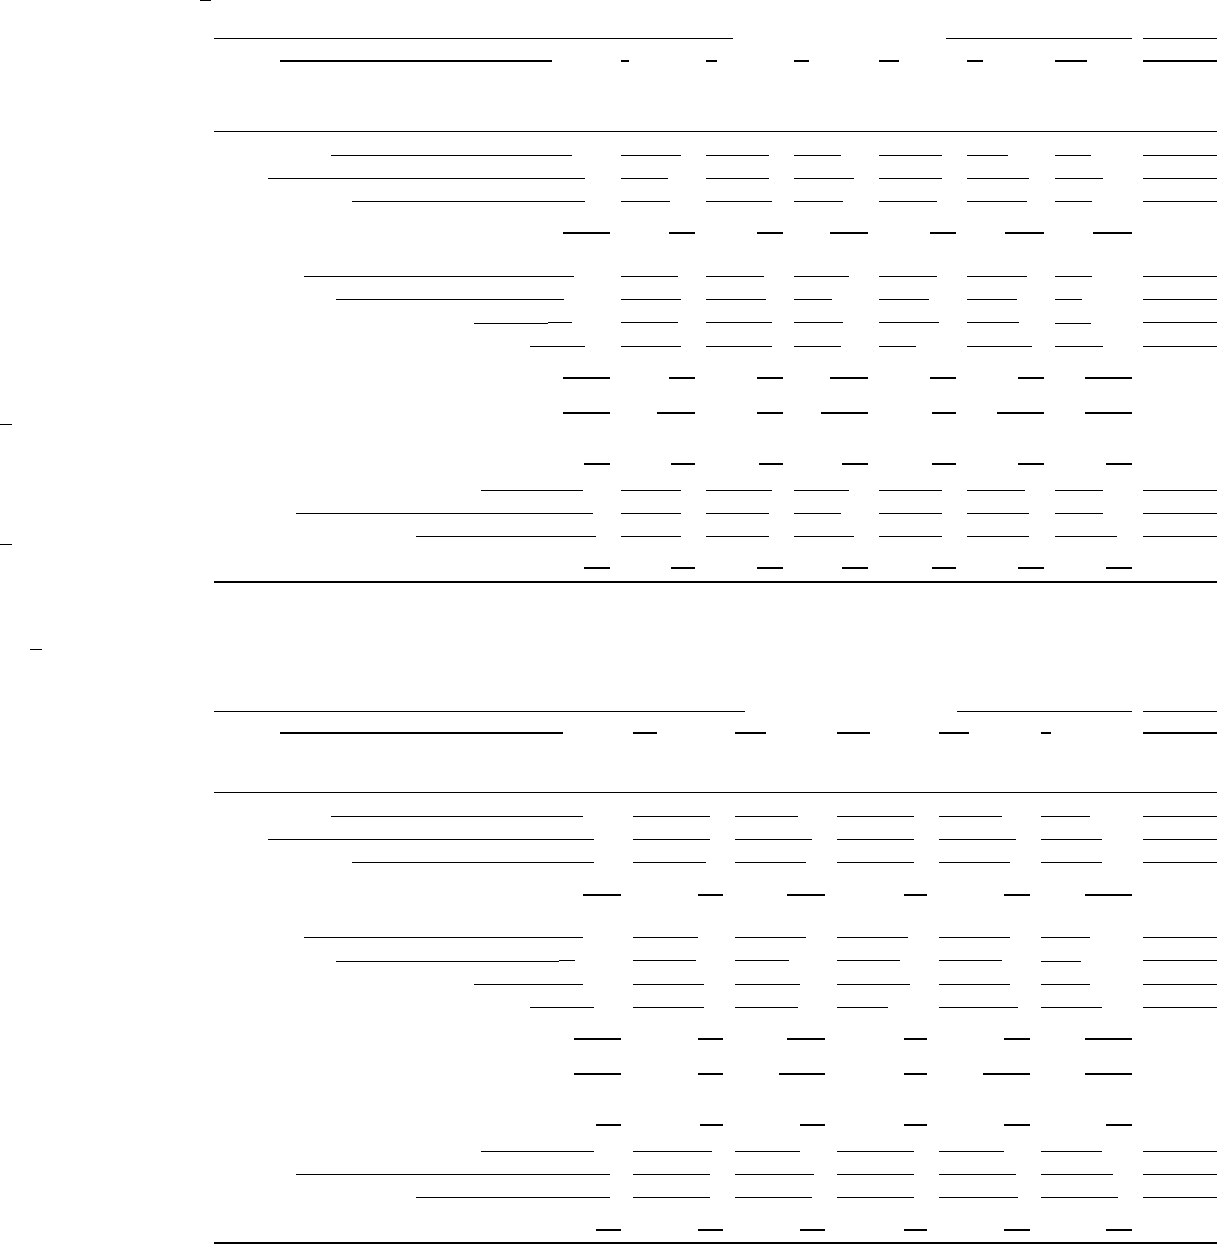
Acquisition and manufacturing cost
in € million 1. 1. 2010 Translation Additions Reclassi- Disposals 31. 12. 2010
differences fications
Development costs 8,695 – 951 – 499 9,147
Goodwill 116 – – – – 116
Other intangible assets 743 12 77 – 38 794
Intangible assets 9,554 12 1,028 – 537 10,057
Land, titles to land, buildings, including buildings on
third party land 7,353 118 94 52 46 7,571
Plant and machinery 22,715 221 1,422 430 622 24,166
Other facilities, factory and office equipment 2,056 54 109 14 91 2,142
Advance payments made and construction in progress
567 21 610 – 496 2 700
Property, plant and equipment 32,6911414 2,235 – 761 34,579
Leased products327,069 982 10,352 – 11,954 26,449
Investments accounted for using
the equity method
137 – 103 – 28 212
Investments in non-consolidated subsidiaries 307 2 120 – 178 251
Participations 8 – 4 – – 12
Non-current marketable securities 4 – – – 4 –
Other investments 319 2 124 – 182 263
1 Including net acquisition and manufacturing cost of property, plant and equipment in conjunction with the first-time consolidation of the Husqvarna Group totalling € 14 million
2 Including assets under construction of € 418 million
3 Adjusted for effect of change in accounting policy for leased products as described in note 8
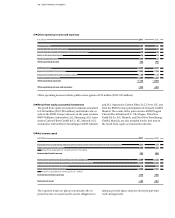
BMW Group
Notes to the Group Financial Statements
Notes to the Balance Sheet
22
Analysis of changes in Group tangible, intangible and investment assets 2011
Analysis of changes in Group tangible, intangible and investment assets 2010
Acquisition and manufacturing cost
in € million 1. 1. 20111
Acquisition
Translation Additions Reclassi- Disposals 31. 12.
ICL Group differences fications 2011
Development costs 9,147 – – 972 – 1,727 8,392
Goodwill 116 258 – – – – 374
Other intangible assets 796 153 5 122 41 78 1,039
Intangible assets 10,059 411 5 1,094 41 1,805 9,805
Land, titles to land, buildings, including buildings on
third party land 7,571 19 47 90 48 17 7,758
Plant and machinery 24,166 – 79 1,483 464 567 25,625
Other facilities, factory and office equipment 2,143 16 9 163 12 183 2,160
Advance payments made and construction in progress
700 – 3 862 – 565 8 992
Property, plant and equipment 34,580 35 138 2,598 – 41 775 36,535
Leased products326,449 5,072 343 11,252 – 11,160 31,956
Investments accounted for using
the equity method
212 – – 113 – 23 302
Investments in non-consolidated subsidiaries 251 – 2 54 – 85 222
Participations 12 – – 489 – – 501
Non-current marketable securities – – – – – – –
Other investments 263 – 2 543 – 85 723
1 Including the net cost of property, plant and equipment of entities consolidated for the first time (excluding the ICL Group)
2 Including assets under construction of € 718 million
3 Adjusted for effect of change in accounting policy for leased products as described in note 8