BMW 2011 Annual Report Download - page 115
Download and view the complete annual report
Please find page 115 of the 2011 BMW annual report below. You can navigate through the pages in the report by either clicking on the pages listed below, or by using the keyword search tool below to find specific information within the annual report.-
 1
1 -
2
-
3
-
4
-
5
-
6
-
7
-
8
-
9
-
10
-
11
-
12
-
13
-
14
-
15
-
16
-
17
-
18
-
19
-
20
-
21
-
22
-
23
-
24
-
25
-
26
-
27
-
28
-
29
-
30
-
31
-
32
-
33
-
34
-
35
-
36
-
37
-
38
-
39
-
40
-
41
-
42
-
43
-
44
-
45
-
46
-
47
-
48
-
49
-
50
-
51
-
52
-
53
-
54
-
55
-
56
-
57
-
58
-
59
-
60
-
61
-
62
-
63
-
64
-
65
-
66
-
67
-
68
-
69
-
70
-
71
-
72
-
73
-
74
-
75
-
76
-
77
-
78
-
79
-
80
-
81
-
82
-
83
-
84
-
85
-
86
-
87
-
88
-
89
-
90
-
91
-
92
-
93
-
94
-
95
-
96
-
97
-
98
-
99
-
100
-
101
-
102
-
103
-
104
-
 105
105 -
 106
106 -
 107
107 -
 108
108 -
 109
109 -
 110
110 -
 111
111 -
 112
112 -
 113
113 -
 114
114 -
 115
115 -
 116
116 -
 117
117 -
 118
118 -
 119
119 -
 120
120 -
 121
121 -
 122
122 -
 123
123 -
 124
124 -
 125
125 -
126
-
127
-
128
-
129
-
130
-
131
-
132
-
133
-
134
-
135
-
136
-
137
-
138
-
139
-
140
-
141
-
142
-
143
-
144
-
145
-
146
-
147
-
148
-
149
-
150
-
151
-
152
-
153
-
154
-
155
-
156
-
157
-
158
-
159
-
160
-
161
-
162
-
163
-
164
-
165
-
166
-
167
-
168
-
169
-
170
-
171
-
172
-
173
-
174
-
175
-
176
-
177
-
178
-
179
-
180
-
181
-
182
-
183
-
184
-
185
-
186
-
187
-
188
-
189
-
190
-
191
-
192
-
193
-
194
-
195
-
196
-
197
-
198
-
199
-
200
-
201
-
202
-
203
-
204
-
205
-
206
-
207
-
208
-
209
-
210
-
211
-
212
-
213
-
214
-
215
-
216
-
217
-
218
-
219
-
220
-
221
-
222
-
223
-
224
-
225
-
226
-
227
-
228
-
229
-
230
-
231
-
232
-
233
-
234
-
235
-
236
-
237
-
238
-
239
-
240
-
241
-
242
-
243
-
244
-
245
-
246
-
247
-
248
-
249
-
250
-
251
-
252
-
253
-
254
-
255
-
256
-
257
-
258
-
259
-
260
-
261
-
262
-
263
-
264
-
265
-
266
-
267
-
268
-
269
-
270
-
271
-
272
-
273
-
274
-
275
-
276
-
277
-
278
-
279
-
280
-
281
-
282
 |
 |

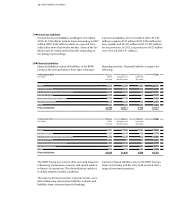
115 GROUP FINANCIAL STATEMENTS
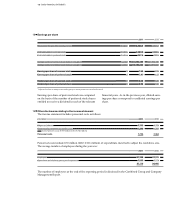
Income tax assets
Income tax assets totalling € 1,194 million (2010: € 1,166
million) include claims amounting to € 872 million (2010:
€ 864 million) which are expected to be settled after more
than 12 months. Some of the claims may be settled
earlier than this depending on the timing of proceedings.
29
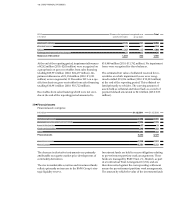
in € million 31. 12. 2011 31. 12. 2010
Other taxes 740 564
Receivables from subsidiaries 714 688
Receivables from other companies in which an investment is held 393 258
Prepayments 945 847
Collateral receivables 292 474
Sundry other assets 829 818
Other assets 3,913 3,649
thereof non-current 568 692
thereof current 3,345 2,957
30
Other assets
Other assets comprise:
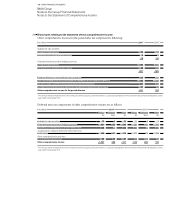
Receivables from subsidiaries include trade receivables
of € 129 million (2010: € 89 million) and financial receiv-
ables of € 585 million (2010: € 599 million). They include
€ 116 million (2010: € 259 million) with a remaining term
of more than one year.
Receivables from other companies in which an invest-
ment is held include € 380 million (2010: € 251 million)
due within one year.
Prepayments of € 945 million (2010: € 847 million) relate
mainly to prepaid interest, development costs not eligible
for capitalisation as non-current assets, insurance
premiums and rent. Prepayments of € 609 million (2010:
€ 542 million) have a maturity of less than one year.
Collateral receivables comprise mainly customary
collateral (banking deposits) arising on the sale of re-
ceivables.
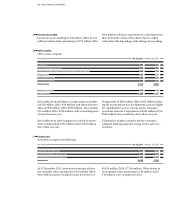
in € million 31. 12. 2011 31. 12. 2010
Raw materials and supplies 704 663
Work in progress, unbilled contracts 908 683
Finished goods and goods for resale 8,026 6,420
Inventories 9,638 7,766
31
Inventories
Inventories comprise the following:
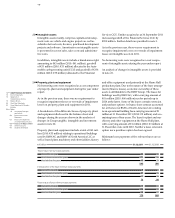
At 31 December 2011, inventories measured at their
net realisable value amounted to € 616 million (2010:
€ 416 million) and are included in total inventories of
€ 9,638 million (2010: € 7,766 million). Write-downs to
net realisable value amounting to € 28 million (2010:
€ 18 million) were recognised in 2011.