BMW 2011 Annual Report Download - page 148
Download and view the complete annual report
Please find page 148 of the 2011 BMW annual report below. You can navigate through the pages in the report by either clicking on the pages listed below, or by using the keyword search tool below to find specific information within the annual report.-
 1
1 -
2
-
3
-
4
-
5
-
6
-
7
-
8
-
9
-
10
-
11
-
12
-
13
-
14
-
15
-
16
-
17
-
18
-
19
-
20
-
21
-
22
-
23
-
24
-
25
-
26
-
27
-
28
-
29
-
30
-
31
-
32
-
33
-
34
-
35
-
36
-
37
-
38
-
39
-
40
-
41
-
42
-
43
-
44
-
45
-
46
-
47
-
48
-
49
-
50
-
51
-
52
-
53
-
54
-
55
-
56
-
57
-
58
-
59
-
60
-
61
-
62
-
63
-
64
-
65
-
66
-
67
-
68
-
69
-
70
-
71
-
72
-
73
-
74
-
75
-
76
-
77
-
78
-
79
-
80
-
81
-
82
-
83
-
84
-
85
-
86
-
87
-
88
-
89
-
90
-
91
-
92
-
93
-
94
-
95
-
96
-
97
-
98
-
99
-
100
-
101
-
102
-
103
-
104
-
105
-
106
-
107
-
108
-
109
-
110
-
111
-
112
-
113
-
114
-
115
-
116
-
117
-
118
-
119
-
120
-
121
-
122
-
123
-
124
-
125
-
126
-
127
-
128
-
129
-
130
-
131
-
132
-
133
-
134
-
135
-
136
-
137
-
 138
138 -
 139
139 -
 140
140 -
 141
141 -
 142
142 -
 143
143 -
 144
144 -
 145
145 -
 146
146 -
 147
147 -
 148
148 -
 149
149 -
 150
150 -
 151
151 -
 152
152 -
 153
153 -
 154
154 -
 155
155 -
 156
156 -
 157
157 -
 158
158 -
159
-
160
-
161
-
162
-
163
-
164
-
165
-
166
-
167
-
168
-
169
-
170
-
171
-
172
-
173
-
174
-
175
-
176
-
177
-
178
-
179
-
180
-
181
-
182
-
183
-
184
-
185
-
186
-
187
-
188
-
189
-
190
-
191
-
192
-
193
-
194
-
195
-
196
-
197
-
198
-
199
-
200
-
201
-
202
-
203
-
204
-
205
-
206
-
207
-
208
-
209
-
210
-
211
-
212
-
213
-
214
-
215
-
216
-
217
-
218
-
219
-
220
-
221
-
222
-
223
-
224
-
225
-
226
-
227
-
228
-
229
-
230
-
231
-
232
-
233
-
234
-
235
-
236
-
237
-
238
-
239
-
240
-
241
-
242
-
243
-
244
-
245
-
246
-
247
-
248
-
249
-
250
-
251
-
252
-
253
-
254
-
255
-
256
-
257
-
258
-
259
-
260
-
261
-
262
-
263
-
264
-
265
-
266
-
267
-
268
-
269
-
270
-
271
-
272
-
273
-
274
-
275
-
276
-
277
-
278
-
279
-
280
-
281
-
282
 |
 |

148
76 GROUP FINANCIAL STATEMENTS
76 Income Statements
76 Statement of
Comprehensive Income
78 Balance Sheets
80 Cash Flow Statements
82 Group Statement of Changes
in Equity
84 Notes
84 Accounting Principles
and Policies
100 Notes to the Income
Statement
107 Notes to the Statement
of Comprehensive Income
108
Notes to the Balance Sheet
129 Other Disclosures
145 Segment Information
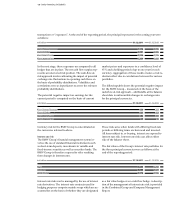
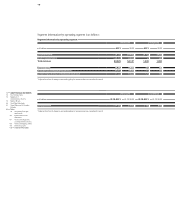
in € million 2011 2010*
Reconciliation of segment result
Total for reportable segments 9,144 5,685
Financial result of Automotive segment and Motorcycles segment – 658 – 474
Elimination of inter-segment items – 1,103 – 358
Group profit before tax 7,383 4,853
Reconciliation of capital expenditure on non-current assets
Total for reportable segments 17,310 15,161
Elimination of inter-segment items – 2,366 – 1,546
Total Group capital expenditure on non-current assets 14,944 13,615
Reconciliation of depreciation and amortisation on non-current assets
Total for reportable segments 8,602 8,511
Elimination of inter-segment items – 1,186 – 1,011
Total Group depreciation and amortisation on non-current assets 7,416 7,500
in € million 31. 12. 2011 31. 12. 2010*
Reconciliation of segment assets
Total for reportable segments 65,611 60,268
Non-operating assets – Other Entities segment 6,045 5,414
Operating liabilities – Financial Services segment 75,540 68,487
Interest-bearing assets – Automotive and Motorcycles segments 32,584 30,300
Liabilities of Automotive and Motorcycles segments not subject to interest 21,226 18,971
Elimination of inter-segment items – 77,577 – 73,276
Total Group assets 123,429 110,164
* Adjusted for effect of change in accounting policy for leased products as described in note 8
Interest and similar income of the Financial Services
segment totalling € 5 million (2010: € 4 million) are in-
cluded in segment results. Interest and similar expenses
of the Financial Services segment amounted to € 15 mil-
lion (2010: € 7 million). The Other Entities segment
result includes interest and similar income amounting
to € 1,739 million (2010: € 1,984 million) and interest and
similar expenses amounting to € 1,841 million (2010:
€ 2,058 million).
Also included in the Other Entities segment result is
the negative result from equity accounted investments
amounting to € 2 million in 2011 (2010: € – million) and
impairment losses on other investments amounting
to € 8 million (2010: € – million).
Segment assets of the Other Entities segment assets at
31 December 2011 included investments accounted for
using the equity method amounting to € 21 million
(2010: € 23 million).
The information disclosed for capital expenditure and
depreciation and amortisation relates to property, plant
and equipment, intangible assets and leased products.
Segment figures can be reconciled to the corresponding
Group figures as follows: