BMW 2011 Annual Report Download - page 57
Download and view the complete annual report
Please find page 57 of the 2011 BMW annual report below. You can navigate through the pages in the report by either clicking on the pages listed below, or by using the keyword search tool below to find specific information within the annual report.-
 1
1 -
2
-
3
-
4
-
5
-
6
-
7
-
8
-
9
-
10
-
11
-
12
-
13
-
14
-
15
-
16
-
17
-
18
-
19
-
20
-
21
-
22
-
23
-
24
-
25
-
26
-
27
-
28
-
29
-
30
-
31
-
32
-
33
-
34
-
35
-
36
-
37
-
38
-
39
-
40
-
41
-
42
-
43
-
44
-
45
-
46
-
 47
47 -
 48
48 -
 49
49 -
 50
50 -
 51
51 -
 52
52 -
 53
53 -
 54
54 -
 55
55 -
 56
56 -
 57
57 -
 58
58 -
 59
59 -
 60
60 -
 61
61 -
 62
62 -
 63
63 -
 64
64 -
 65
65 -
 66
66 -
 67
67 -
68
-
69
-
70
-
71
-
72
-
73
-
74
-
75
-
76
-
77
-
78
-
79
-
80
-
81
-
82
-
83
-
84
-
85
-
86
-
87
-
88
-
89
-
90
-
91
-
92
-
93
-
94
-
95
-
96
-
97
-
98
-
99
-
100
-
101
-
102
-
103
-
104
-
105
-
106
-
107
-
108
-
109
-
110
-
111
-
112
-
113
-
114
-
115
-
116
-
117
-
118
-
119
-
120
-
121
-
122
-
123
-
124
-
125
-
126
-
127
-
128
-
129
-
130
-
131
-
132
-
133
-
134
-
135
-
136
-
137
-
138
-
139
-
140
-
141
-
142
-
143
-
144
-
145
-
146
-
147
-
148
-
149
-
150
-
151
-
152
-
153
-
154
-
155
-
156
-
157
-
158
-
159
-
160
-
161
-
162
-
163
-
164
-
165
-
166
-
167
-
168
-
169
-
170
-
171
-
172
-
173
-
174
-
175
-
176
-
177
-
178
-
179
-
180
-
181
-
182
-
183
-
184
-
185
-
186
-
187
-
188
-
189
-
190
-
191
-
192
-
193
-
194
-
195
-
196
-
197
-
198
-
199
-
200
-
201
-
202
-
203
-
204
-
205
-
206
-
207
-
208
-
209
-
210
-
211
-
212
-
213
-
214
-
215
-
216
-
217
-
218
-
219
-
220
-
221
-
222
-
223
-
224
-
225
-
226
-
227
-
228
-
229
-
230
-
231
-
232
-
233
-
234
-
235
-
236
-
237
-
238
-
239
-
240
-
241
-
242
-
243
-
244
-
245
-
246
-
247
-
248
-
249
-
250
-
251
-
252
-
253
-
254
-
255
-
256
-
257
-
258
-
259
-
260
-
261
-
262
-
263
-
264
-
265
-
266
-
267
-
268
-
269
-
270
-
271
-
272
-
273
-
274
-
275
-
276
-
277
-
278
-
279
-
280
-
281
-
282
 |
 |
57 COMBINED GROUP AND COMPANY MANAGEMENT REPORT
the level of the previous year. The corresponding amor-
tisation expense was € 1,209 million (2010: € 1,260 mil-
lion). Goodwill went up by € 258 million from € 111 mil-
lion to € 369 million as a result of the acquisition of the
ICL Group.
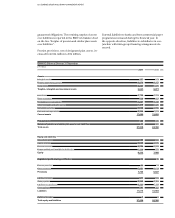
The carrying amount of property, plant and equipment
increased slightly (+ 2.3 %) to € 11,685 million. Capital
expenditure of € 2,598 million was 16.2 % higher than in
the previous year (2010: € 2,235 million). The main focus
was on product investments for production start-ups and
infrastructure improvements. Depreciation on property,
plant and equipment totalled € 2,324 million (+ 0.9 %).
The purchase of the ICL Group caused property, plant
and equipment to increase by € 23 million. Total capi-
tal
expenditure on intangible assets and property, plant
and equipment as a percentage of revenues was un-
changed at 5.4 %.
Leased products climbed by € 4,024 million or 21.1 %.
Ex-
cluding the effect of exchange rate fluctuations,
leased
products would have increased by 19.7 %. As a result of
the first-time consolidation of the ICL Group, leased
products increased by € 3,385 million.
Other investments increased by € 384 million to € 561
million, mainly reflecting the purchase of shares in SGL
Carbon SE at an acquisition cost of € 487 million.
Receivables from sales financing were up by 8.8 % to
€ 49,345 million due to higher business volumes. Of
this amount, customer and dealer financing accounted
for € 38,295 million (+ 8.0 %) and finance leases for
€ 11,050 million (+ 11.6 %).
Compared to the end of the previous financial year, the
carrying amount of inventories went up by € 1,872 mil-
lion to € 9,638 million (+ 24.1 %). Adjusted for exchange
rate factors, the increase would have been 22.5 %. Stock-
ing
up in conjunction with the introduction of new
models and expanding business operations were the
main reasons for the increase.
Trade receivables ended up 41.1 % higher than at 31
De-
cember 2010, mainly reflecting increased business
volumes.
Financial assets went up by 6.3 % to € 5,453 million,
largely
due to higher levels of marketable securities and
invest-
ment fund shares, whilst the overall increase was kept
down by fair value losses.
Liquid funds increased by 12.3 % to € 10,106 million and
comprise cash and cash equivalents, marketable secu-
rities
and investment fund shares (the last two items
reported as financial assets). The carrying amount of
marketable securities and investment fund shares rose
by € 764 million.
Cash and cash equivalents went up by € 344 million to
€ 7,776 million.
On the equity and liabilities side of the balance sheet,
equity rose overall by € 3,173 million (+ 13.3 %) to
€ 27,103 million. It increased as a result of the net profit
for the year of € 4,907 million and translation differ-
ences of € 201 million arising on currency translation.
Deferred taxes on items recognised directly in equity in-
creased equity by a further € 446 million. Group equity
decreased as a result of actuarial losses on pension obli-
gations resulting from lower interest rates (down by
€ 586 million) and in conjunction with the fair value
measurement of derivative financial instruments (down
by € 801 million) and marketable securities (down by
€ 72 million). Income and expenses relating to equity ac-
counted investments and recognised directly in equity,
net of deferred tax, reduced equity by € 41
million. The
dividend payment decreased equity by € 852
million.
A portion of the Authorised Capital created at the
Annual General Meeting held on 14 May 2009 in con-
junction with the employee share scheme was used
during the financial year under report to issue shares
of preferred stock to employees, thereby increasing
subscribed capital by € 0.4 million. An amount of € 16
million was transferred to capital reserves in conjunc-
tion with this share capital increase. Other items in-
creased equity by € 13 million.
The equity ratio of the BMW Group improved overall by
0.3 percentage points to 22.0 %. The equity ratio of the
Automotive segment was 41.1 % (2010: 40.9 %) and that
of the Financial Services segment was 8.7 % (2010: 7.1 %).
Pension provisions increased by 39.7 % to € 2,183 million
as a result of lower discount factors used in the UK and
the USA. In the case of pension plans with fund assets,
the fair value of fund assets is offset against the defined
benefit obligation.
Other provisions rose by € 706 million (+ 12.7 %) to
€ 6,253 million, with € 473 million of the increase relating
to miscellaneous provisions. Personnel-related provisions