BMW 2011 Annual Report Download - page 135
Download and view the complete annual report
Please find page 135 of the 2011 BMW annual report below. You can navigate through the pages in the report by either clicking on the pages listed below, or by using the keyword search tool below to find specific information within the annual report.-
 1
1 -
2
-
3
-
4
-
5
-
6
-
7
-
8
-
9
-
10
-
11
-
12
-
13
-
14
-
15
-
16
-
17
-
18
-
19
-
20
-
21
-
22
-
23
-
24
-
25
-
26
-
27
-
28
-
29
-
30
-
31
-
32
-
33
-
34
-
35
-
36
-
37
-
38
-
39
-
40
-
41
-
42
-
43
-
44
-
45
-
46
-
47
-
48
-
49
-
50
-
51
-
52
-
53
-
54
-
55
-
56
-
57
-
58
-
59
-
60
-
61
-
62
-
63
-
64
-
65
-
66
-
67
-
68
-
69
-
70
-
71
-
72
-
73
-
74
-
75
-
76
-
77
-
78
-
79
-
80
-
81
-
82
-
83
-
84
-
85
-
86
-
87
-
88
-
89
-
90
-
91
-
92
-
93
-
94
-
95
-
96
-
97
-
98
-
99
-
100
-
101
-
102
-
103
-
104
-
105
-
106
-
107
-
108
-
109
-
110
-
111
-
112
-
113
-
114
-
115
-
116
-
117
-
118
-
119
-
120
-
121
-
122
-
123
-
124
-
 125
125 -
 126
126 -
 127
127 -
 128
128 -
 129
129 -
 130
130 -
 131
131 -
 132
132 -
 133
133 -
 134
134 -
 135
135 -
 136
136 -
 137
137 -
 138
138 -
 139
139 -
 140
140 -
 141
141 -
 142
142 -
 143
143 -
 144
144 -
 145
145 -
146
-
147
-
148
-
149
-
150
-
151
-
152
-
153
-
154
-
155
-
156
-
157
-
158
-
159
-
160
-
161
-
162
-
163
-
164
-
165
-
166
-
167
-
168
-
169
-
170
-
171
-
172
-
173
-
174
-
175
-
176
-
177
-
178
-
179
-
180
-
181
-
182
-
183
-
184
-
185
-
186
-
187
-
188
-
189
-
190
-
191
-
192
-
193
-
194
-
195
-
196
-
197
-
198
-
199
-
200
-
201
-
202
-
203
-
204
-
205
-
206
-
207
-
208
-
209
-
210
-
211
-
212
-
213
-
214
-
215
-
216
-
217
-
218
-
219
-
220
-
221
-
222
-
223
-
224
-
225
-
226
-
227
-
228
-
229
-
230
-
231
-
232
-
233
-
234
-
235
-
236
-
237
-
238
-
239
-
240
-
241
-
242
-
243
-
244
-
245
-
246
-
247
-
248
-
249
-
250
-
251
-
252
-
253
-
254
-
255
-
256
-
257
-
258
-
259
-
260
-
261
-
262
-
263
-
264
-
265
-
266
-
267
-
268
-
269
-
270
-
271
-
272
-
273
-
274
-
275
-
276
-
277
-
278
-
279
-
280
-
281
-
282
 |
 |

135 GROUP FINANCIAL STATEMENTS
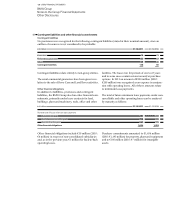
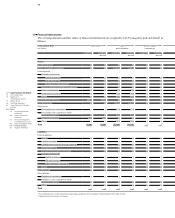
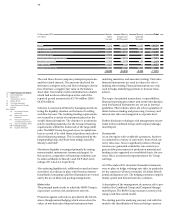
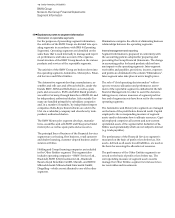
in € million 2011 2010
Held for trading
Gains / losses from the use of derivative instruments – 565 15
Available-for-sale
Gains and losses on sale and fair value measurement of marketable securities held for sale
(including investments in subsidiaries and participations measured at cost) – 13 – 175
Income from investments 1 5
Accumulated other equity
Balance at 1 January 9 20
Total change during the year – 70 – 11
of which recognised in the income statement during the period under report – 8 3
Balance at 31 December – 61 9
Loans and receivables
Impairment losses / reversals of impairment losses – 340 – 581
Other income / expenses – 101 – 69
Other liabilities
Income / expenses – 91 – 90
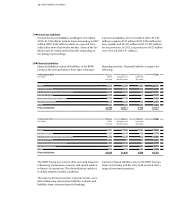
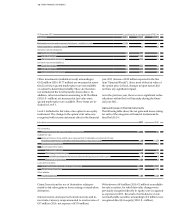
Other investments (available-for-sale) amounting to
€ 142 million (2010: € 177 million) are measured at amor-
tised cost since quoted market prices are not available
or cannot be determined reliably. These are therefore
not included in the level hierarchy shown above. In
addition, other investments amounting to € 419 million
(2010: € – million) are measured at fair value since
quoted market prices are available. These items are in-
cluded in Level 1.
Level 3 includes the fair value of an option to an equity
instrument. The change in the option’s fair value was
recognised with income statement effect in the financial
year 2011 (income of € 20 million reported in the line
item “Financial Result”). Since most of the fair value of
the option price is fixed, changes in input factors did
not have any significant impact.
As in the previous year, there were no significant reclas-
sifications within the level hierarchy during the finan-
cial year 2011.
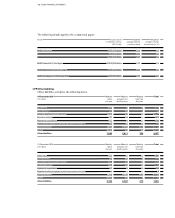
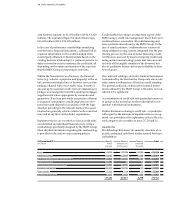
Gains and losses on financial instruments
The following table shows the net gains and losses arising
for each of the categories of financial instrument de-
fined by IAS 39:
Gains / losses from the use of derivatives relate pri-
marily
to fair value gains or losses arising on stand-alone
derivatives.
Interest income and expense from interest rate and in-
terest rate / currency swaps amounted to a net income of
€ 57 million (2010: net expense of € 178 million).
Write-downs of € 4 million (2010: € 3 million) on available-
for-sale securities, for which fair value changes were
previously recognised directly in equity, were recognised
as expenses in 2011. Reversals of write-downs on cur-
rent marketable securities amounting to € 2 million were
recognised directly in equity (2010: € – million).
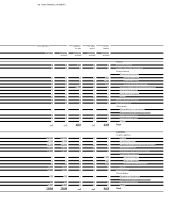
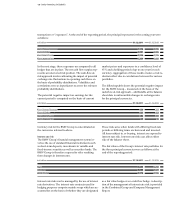
31 December 2010 Level hierarchy in accordance with IFRS 7
in € million Level 1 Level 2 Level 3
Marketable securities and investment fund shares – available-for-sale 1,566 – –
Other investments – available-for-sale – – –
Derivative instruments (assets)
Cash flow hedges – 900 –
Fair value hedges – 1,102 –
Other derivative instruments – 779 –
Derivative instruments (liabilities)
Cash flow hedges – 921 –
Fair value hedges – 375 –
Other derivative instruments – 714 –