BMW 2011 Annual Report Download - page 134
Download and view the complete annual report
Please find page 134 of the 2011 BMW annual report below. You can navigate through the pages in the report by either clicking on the pages listed below, or by using the keyword search tool below to find specific information within the annual report.-
 1
1 -
2
-
3
-
4
-
5
-
6
-
7
-
8
-
9
-
10
-
11
-
12
-
13
-
14
-
15
-
16
-
17
-
18
-
19
-
20
-
21
-
22
-
23
-
24
-
25
-
26
-
27
-
28
-
29
-
30
-
31
-
32
-
33
-
34
-
35
-
36
-
37
-
38
-
39
-
40
-
41
-
42
-
43
-
44
-
45
-
46
-
47
-
48
-
49
-
50
-
51
-
52
-
53
-
54
-
55
-
56
-
57
-
58
-
59
-
60
-
61
-
62
-
63
-
64
-
65
-
66
-
67
-
68
-
69
-
70
-
71
-
72
-
73
-
74
-
75
-
76
-
77
-
78
-
79
-
80
-
81
-
82
-
83
-
84
-
85
-
86
-
87
-
88
-
89
-
90
-
91
-
92
-
93
-
94
-
95
-
96
-
97
-
98
-
99
-
100
-
101
-
102
-
103
-
104
-
105
-
106
-
107
-
108
-
109
-
110
-
111
-
112
-
113
-
114
-
115
-
116
-
117
-
118
-
119
-
120
-
121
-
122
-
123
-
 124
124 -
 125
125 -
 126
126 -
 127
127 -
 128
128 -
 129
129 -
 130
130 -
 131
131 -
 132
132 -
 133
133 -
 134
134 -
 135
135 -
 136
136 -
 137
137 -
 138
138 -
 139
139 -
 140
140 -
 141
141 -
 142
142 -
 143
143 -
 144
144 -
145
-
146
-
147
-
148
-
149
-
150
-
151
-
152
-
153
-
154
-
155
-
156
-
157
-
158
-
159
-
160
-
161
-
162
-
163
-
164
-
165
-
166
-
167
-
168
-
169
-
170
-
171
-
172
-
173
-
174
-
175
-
176
-
177
-
178
-
179
-
180
-
181
-
182
-
183
-
184
-
185
-
186
-
187
-
188
-
189
-
190
-
191
-
192
-
193
-
194
-
195
-
196
-
197
-
198
-
199
-
200
-
201
-
202
-
203
-
204
-
205
-
206
-
207
-
208
-
209
-
210
-
211
-
212
-
213
-
214
-
215
-
216
-
217
-
218
-
219
-
220
-
221
-
222
-
223
-
224
-
225
-
226
-
227
-
228
-
229
-
230
-
231
-
232
-
233
-
234
-
235
-
236
-
237
-
238
-
239
-
240
-
241
-
242
-
243
-
244
-
245
-
246
-
247
-
248
-
249
-
250
-
251
-
252
-
253
-
254
-
255
-
256
-
257
-
258
-
259
-
260
-
261
-
262
-
263
-
264
-
265
-
266
-
267
-
268
-
269
-
270
-
271
-
272
-
273
-
274
-
275
-
276
-
277
-
278
-
279
-
280
-
281
-
282
 |
 |

134
76 GROUP FINANCIAL STATEMENTS
76 Income Statements
76 Statement of
Comprehensive Income
78 Balance Sheets
80 Cash Flow Statements
82 Group Statement of Changes
in Equity
84 Notes
84 Accounting Principles
and Policies
100 Notes to the Income
Statement
107 Notes to the Statement
of Comprehensive Income
108
Notes to the Balance Sheet
129 Other Disclosures
145 Segment Information
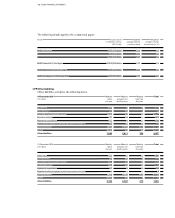
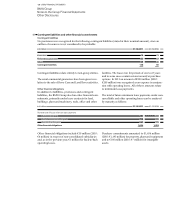
ISO-Code EUR USD GBP JPY
in %
Interest rate for six months 0.85 0.37 0.79 0.23
Interest rate for one year 0.78 0.45 0.77 0.31
Interest rate for five years 1.75 1.23 1.57 0.46
Interest rate for ten years 2.45 2.06 2.35 1.00
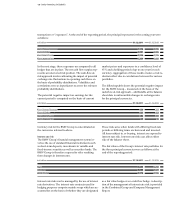
Fair value measurement of financial instruments
The fair values shown are computed using market in-
formation available at the balance sheet date, on the
basis of prices quoted by the contract partners or using
appropriate measurement methods, e. g. discounted
cash flow models. In the latter case, amounts were
discounted at 31 December 2011 on the basis of the
following interest rates:
Interest rates taken from interest rate curves were
adjusted, where necessary, to take account of the
credit quality and risk of the underlying financial
instrument.
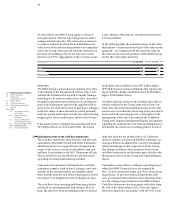
Derivative financial instruments are measured at their
fair value. The fair values of derivative financial instru-
ments are determined using measurement models, as
a consequence of which there is a risk that the amounts
calculated could differ from realisable market prices
on disposal. Observable financial market price spreads
(e. g. for liquidity risks) are taken into account in the
measurement of derivative financial instruments, thus
helping to minimise differences between the carrying
amounts of the instruments and the amounts that can be
realised on the financial markets on the disposal of those
instruments.
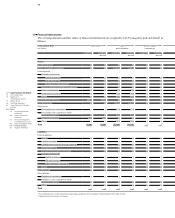
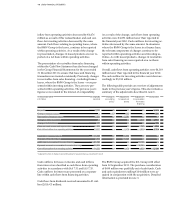
Financial instruments measured at fair value are allo-
cated to different measurement levels in accordance
with IFRS 7. This includes financial instruments that
are
1 valued according to quoted prices in an active mar-
ket for identical financial instruments (Level 1),
2 valued according to quoted prices in an active mar-
ket
for comparative financial instruments or using
valuation models whose main input factors are based
on observable market data (Level 2), or
3 valued using input factors that are not based on ob-
servable market data (Level 3).
The following table shows the amounts allocated to
each measurement level at 31 December 2011:
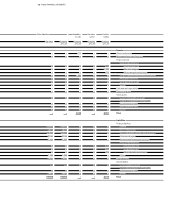
31 December 2011 Level hierarchy in accordance with IFRS 7
in € million Level 1 Level 2 Level 3
Marketable securities and investment fund shares – available-for-sale 2,330 – –
Other investments – available-for-sale 419 – –
Derivative instruments (assets)
Cash flow hedges – 281 –
Fair value hedges – 1,230 –
Other derivative instruments – 827 20
Derivative instruments (liabilities)
Cash flow hedges – 1,259 –
Fair value hedges – 347 –
Other derivative instruments – 873 –