Audi 2012 Annual Report Download - page 3
Download and view the complete annual report
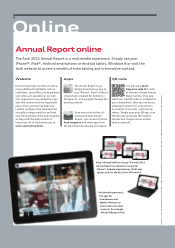
Please find page 3 of the 2012 Audi annual report below. You can navigate through the pages in the report by either clicking on the pages listed below, or by using the keyword search tool below to find specific information within the annual report.-
 1
1 -
 2
2 -
 3
3 -
 4
4 -
 5
5 -
 6
6 -
 7
7 -
 8
8 -
 9
9 -
 10
10 -
 11
11 -
 12
12 -
 13
13 -
 14
14 -
15
-
16
-
17
-
18
-
19
-
20
-
21
-
22
-
23
-
24
-
25
-
26
-
27
-
28
-
29
-
30
-
31
-
32
-
33
-
34
-
35
-
36
-
37
-
38
-
39
-
40
-
41
-
42
-
43
-
44
-
45
-
46
-
47
-
48
-
49
-
50
-
51
-
52
-
53
-
54
-
55
-
56
-
57
-
58
-
59
-
60
-
61
-
62
-
63
-
64
-
65
-
66
-
67
-
68
-
69
-
70
-
71
-
72
-
73
-
74
-
75
-
76
-
77
-
78
-
79
-
80
-
81
-
82
-
83
-
84
-
85
-
86
-
87
-
88
-
89
-
90
-
91
-
92
-
93
-
94
-
95
-
96
-
97
-
98
-
99
-
100
-
101
-
102
-
103
-
104
-
105
-
106
-
107
-
108
-
109
-
110
-
111
-
112
-
113
-
114
-
115
-
116
-
117
-
118
-
119
-
120
-
121
-
122
-
123
-
124
-
125
-
126
-
127
-
128
-
129
-
130
-
131
-
132
-
133
-
134
-
135
-
136
-
137
-
138
-
139
-
140
-
141
-
142
-
143
-
144
-
145
-
146
-
147
-
148
-
149
-
150
-
151
-
152
-
153
-
154
-
155
-
156
-
157
-
158
-
159
-
160
-
161
-
162
-
163
-
164
-
165
-
166
-
167
-
168
-
169
-
170
-
171
-
172
-
173
-
174
-
175
-
176
-
177
-
178
-
179
-
180
-
181
-
182
-
183
-
184
-
185
-
186
-
187
-
188
-
189
-
190
-
191
-
192
-
193
-
194
-
195
-
196
-
197
-
198
-
199
-
200
-
201
-
202
-
203
-
204
-
205
-
206
-
207
-
208
-
209
-
210
-
211
-
212
-
213
-
214
-
215
-
216
-
217
-
218
-
219
-
220
-
221
-
222
-
223
-
224
-
225
-
226
-
227
-
228
-
229
-
230
-
231
-
232
-
233
-
234
-
235
-
236
-
237
-
238
-
239
-
240
-
241
-
242
-
243
-
244
-
245
-
246
-
247
-
248
-
249
-
250
-
251
-
252
-
253
-
254
-
255
-
256
-
257
-
258
-
259
-
260
-
261
-
262
-
263
-
264
-
265
-
266
-
267
-
268
-
269
-
270
-
271
-
272
-
273
-
274
-
275
-
276
-
277
-
278
-
279
-
280
-
281
-
282
-
283
-
284
-
285
 |
 |

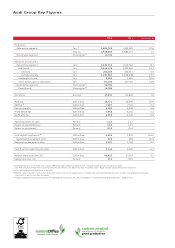
Audi Group Key Figures
2012 2011 Change in %
Production
Automotive segment Cars 1) 1,469,205 1,302,981 12.8
Engines 1,916,604 1,884,157 1.7
Motorcycles segment Motorcycles 2) 15,734 – –
Deliveries to customers
Automotive segment Cars 1,634,312 1,512,014 8.1
Audi brand Cars 1,455,123 1,302,659 11.7
Germany Cars 263,163 254,011 3.6
Outside Germany Cars 1,191,960 1,048,648 13.7
Lamborghini brand Cars 2,083 1,602 30.0
Other Volkswagen Group brands Cars 177, 10 6 207,753 – 14.8
Motorcycles segment Motorcycles 2) 16,786 – –
Ducati brand Motorcycles 2) 16,786 – –
Workforce Average 67, 2 31 62,806 7.0
Revenue EUR million 48,771 44,096 10.6
EBITDA 3) EUR million 7,2 97 7,141 2.2
Operating profit EUR million 5,380 5,348 0.6
Profit before tax EUR million 5,956 6,041 – 1.4
Profit after tax EUR million 4,353 4,440 – 2.0
Operating return on sales Percent 11.0 12.1
Return on sales before tax Percent 12.2 13.7
Return on investment Percent 30.9 35.4
Total capital investments 4) EUR million 6,416 2,970 116.0
Capitalized development costs EUR million 923 596 54.9
Depreciation and amortization EUR million 1,937 1,793 8.0
Cash flow from operating activities EUR million 6,144 6,295 – 2.4
Balance sheet total (Dec. 31) EUR million 40,425 37,019 9.2
Equity ratio (Dec. 31) Percent 37. 2 34.9
1) Including vehicles manufactured in China by the FAW-Volkswagen Automotive Company, Ltd., Changchun, joint venture since January 1, 2012.
333,465 (216,053) vehicles were manufactured by the joint venture in the 2012 fiscal year. The previous year’s figure has been adjusted for ease of comparison.
2) Since acquisition of the Ducati Group in July 2012
3) EBITDA = operating profit + balance from impairment losses (reversals) on property, plant and equipment, capitalized development costs, leased assets, goodwill and long-term
investments as per the Cash Flow Statement
4) In 2012 including the acquisition of interests in Volkswagen Group Services S.A., Brussels (Belgium), and in DUCATI MOTOR HOLDING S.P.A., Bologna (Italy)
carbon neutral
natureOffice.com | DE-250-835156
print production