Audi 2012 Annual Report Download - page 250
Download and view the complete annual report
Please find page 250 of the 2012 Audi annual report below. You can navigate through the pages in the report by either clicking on the pages listed below, or by using the keyword search tool below to find specific information within the annual report.-
 1
1 -
2
-
3
-
4
-
5
-
6
-
7
-
8
-
9
-
10
-
11
-
12
-
13
-
14
-
15
-
16
-
17
-
18
-
19
-
20
-
21
-
22
-
23
-
24
-
25
-
26
-
27
-
28
-
29
-
30
-
31
-
32
-
33
-
34
-
35
-
36
-
37
-
38
-
39
-
40
-
41
-
42
-
43
-
44
-
45
-
46
-
47
-
48
-
49
-
50
-
51
-
52
-
53
-
54
-
55
-
56
-
57
-
58
-
59
-
60
-
61
-
62
-
63
-
64
-
65
-
66
-
67
-
68
-
69
-
70
-
71
-
72
-
73
-
74
-
75
-
76
-
77
-
78
-
79
-
80
-
81
-
82
-
83
-
84
-
85
-
86
-
87
-
88
-
89
-
90
-
91
-
92
-
93
-
94
-
95
-
96
-
97
-
98
-
99
-
100
-
101
-
102
-
103
-
104
-
105
-
106
-
107
-
108
-
109
-
110
-
111
-
112
-
113
-
114
-
115
-
116
-
117
-
118
-
119
-
120
-
121
-
122
-
123
-
124
-
125
-
126
-
127
-
128
-
129
-
130
-
131
-
132
-
133
-
134
-
135
-
136
-
137
-
138
-
139
-
140
-
141
-
142
-
143
-
144
-
145
-
146
-
147
-
148
-
149
-
150
-
151
-
152
-
153
-
154
-
155
-
156
-
157
-
158
-
159
-
160
-
161
-
162
-
163
-
164
-
165
-
166
-
167
-
168
-
169
-
170
-
171
-
172
-
173
-
174
-
175
-
176
-
177
-
178
-
179
-
180
-
181
-
182
-
183
-
184
-
185
-
186
-
187
-
188
-
189
-
190
-
191
-
192
-
193
-
194
-
195
-
196
-
197
-
198
-
199
-
200
-
201
-
202
-
203
-
204
-
205
-
206
-
207
-
208
-
209
-
210
-
211
-
212
-
213
-
214
-
215
-
216
-
217
-
218
-
219
-
220
-
221
-
222
-
223
-
224
-
225
-
226
-
227
-
228
-
229
-
230
-
231
-
232
-
233
-
234
-
235
-
236
-
237
-
238
-
239
-
 240
240 -
 241
241 -
 242
242 -
 243
243 -
 244
244 -
 245
245 -
 246
246 -
 247
247 -
 248
248 -
 249
249 -
 250
250 -
 251
251 -
 252
252 -
 253
253 -
 254
254 -
 255
255 -
 256
256 -
 257
257 -
 258
258 -
 259
259 -
 260
260 -
261
-
262
-
263
-
264
-
265
-
266
-
267
-
268
-
269
-
270
-
271
-
272
-
273
-
274
-
275
-
276
-
277
-
278
-
279
-
280
-
281
-
282
-
283
-
284
-
285
 |
 |

253
Consolidated Financial
Statements
202 Income Statement
203 Statement of Recognized
Income and Expense
204 Balance Sheet
205 Cash Flow Statement
206 Statement of Changes in Equity
Notes to the Consolidated
Financial Statements
208 Development of fixed assets
in the 2012 fiscal year
210 Development of fixed assets
in the 2011 fiscal year
212 General information
218 Recognition and
measurement principles
227 Notes to the Income Statement
233 Notes to the Balance Sheet
244 Additional disclosures
266 Events occurring subsequent to
the balance sheet date
267 Statement of Interests
held by the Audi Group
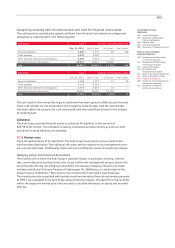
Analysis by maturity date of undiscounted cash used for financial instruments
The undiscounted, contractually agreed cashflows from financial instruments are categorized
separately by maturity date in the following table:
EUR million Total Residual contractual maturities
Dec. 31, 2012 Up to 1 year 1 to 5 years Over 5 years
Financial liabilities 1,390 1,172 49 168
Trade payables 4,270 4,270 ––
Other financial liabilities and obligations 4,350 4,324 26 –
Derivative financial instruments 26,561 10,931 15,630 –
Total 36,571 20,697 15,705 168
EUR million Total Residual contractual maturities
Dec. 31, 2011 Up to 1 year 1 to 5 years Over 5 years
Financial liabilities 1,198 1,173 13 12
Trade payables 4,193 4,193 ––
Other financial liabilities and obligations 4,070 4,041 24 –
Derivative financial instruments 28,221 10,422 17,799 –
Total 37,682 19,829 17,836 12
The cash used for derivatives where gross settlement has been agreed is offset by cash received.
These cash receipts are not presented in the analysis by maturity date. Had the cash receipts
also been taken into account, the cash used would have been significantly lower in the analysis
by maturity date.
Collateral
The Audi Group recorded financial assets as collateral for liabilities in the amount of
EUR 98 (234) million. This collateral is used by contractual parties primarily as soon as credit
periods for secured liabilities are exceeded.
37.4 Market risks
Given the global nature of its operations, the Audi Group is exposed to various market risks,
which are described below. The individual risk types and the respective risk management meas-
ures are also described. Additionally, these risks are quantified by means of sensitivity analyses.
Hedging policy and financial derivatives
The market risks to which the Audi Group is exposed include, in particular, currency, interest
rate, commodity price and fund price risks. As part of the risk management process, these risks
are limited by entering into hedging transactions. All necessary hedging measures are imple-
mented centrally by the Group Treasury of Volkswagen AG, Wolfsburg, or coordinated via the
Group Treasury of AUDI AG. There were no risk concentrations during the past fiscal year.
The market price risks associated with derivative and non-derivative financial instruments pursuant
to IFRS 7 are calculated in the Audi Group using sensitivity analyses. Changes to the risk variables
within the respective market price risks are used to calculate the impact on equity and on profit
after tax.