Audi 2012 Annual Report Download - page 260
Download and view the complete annual report
Please find page 260 of the 2012 Audi annual report below. You can navigate through the pages in the report by either clicking on the pages listed below, or by using the keyword search tool below to find specific information within the annual report.-
 1
1 -
2
-
3
-
4
-
5
-
6
-
7
-
8
-
9
-
10
-
11
-
12
-
13
-
14
-
15
-
16
-
17
-
18
-
19
-
20
-
21
-
22
-
23
-
24
-
25
-
26
-
27
-
28
-
29
-
30
-
31
-
32
-
33
-
34
-
35
-
36
-
37
-
38
-
39
-
40
-
41
-
42
-
43
-
44
-
45
-
46
-
47
-
48
-
49
-
50
-
51
-
52
-
53
-
54
-
55
-
56
-
57
-
58
-
59
-
60
-
61
-
62
-
63
-
64
-
65
-
66
-
67
-
68
-
69
-
70
-
71
-
72
-
73
-
74
-
75
-
76
-
77
-
78
-
79
-
80
-
81
-
82
-
83
-
84
-
85
-
86
-
87
-
88
-
89
-
90
-
91
-
92
-
93
-
94
-
95
-
96
-
97
-
98
-
99
-
100
-
101
-
102
-
103
-
104
-
105
-
106
-
107
-
108
-
109
-
110
-
111
-
112
-
113
-
114
-
115
-
116
-
117
-
118
-
119
-
120
-
121
-
122
-
123
-
124
-
125
-
126
-
127
-
128
-
129
-
130
-
131
-
132
-
133
-
134
-
135
-
136
-
137
-
138
-
139
-
140
-
141
-
142
-
143
-
144
-
145
-
146
-
147
-
148
-
149
-
150
-
151
-
152
-
153
-
154
-
155
-
156
-
157
-
158
-
159
-
160
-
161
-
162
-
163
-
164
-
165
-
166
-
167
-
168
-
169
-
170
-
171
-
172
-
173
-
174
-
175
-
176
-
177
-
178
-
179
-
180
-
181
-
182
-
183
-
184
-
185
-
186
-
187
-
188
-
189
-
190
-
191
-
192
-
193
-
194
-
195
-
196
-
197
-
198
-
199
-
200
-
201
-
202
-
203
-
204
-
205
-
206
-
207
-
208
-
209
-
210
-
211
-
212
-
213
-
214
-
215
-
216
-
217
-
218
-
219
-
220
-
221
-
222
-
223
-
224
-
225
-
226
-
227
-
228
-
229
-
230
-
231
-
232
-
233
-
234
-
235
-
236
-
237
-
238
-
239
-
240
-
241
-
242
-
243
-
244
-
245
-
246
-
247
-
248
-
249
-
 250
250 -
 251
251 -
 252
252 -
 253
253 -
 254
254 -
 255
255 -
 256
256 -
 257
257 -
 258
258 -
 259
259 -
 260
260 -
 261
261 -
 262
262 -
 263
263 -
 264
264 -
 265
265 -
 266
266 -
 267
267 -
 268
268 -
 269
269 -
 270
270 -
271
-
272
-
273
-
274
-
275
-
276
-
277
-
278
-
279
-
280
-
281
-
282
-
283
-
284
-
285
 |
 |

263
Consolidated Financial
Statements
202 Income Statement
203 Statement of Recognized
Income and Expense
204 Balance Sheet
205 Cash Flow Statement
206 Statement of Changes in Equity
Notes to the Consolidated
Financial Statements
208 Development of fixed assets
in the 2012 fiscal year
210 Development of fixed assets
in the 2011 fiscal year
212 General information
218 Recognition and
measurement principles
227 Notes to the Income Statement
233 Notes to the Balance Sheet
244 Additional disclosures
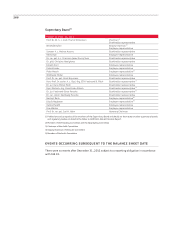
266 Events occurring subsequent to
the balance sheet date
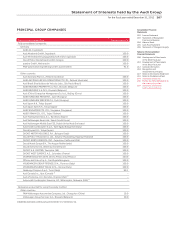
267 Statement of Interests
held by the Audi Group
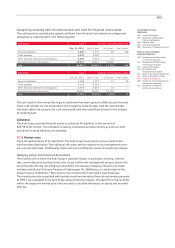
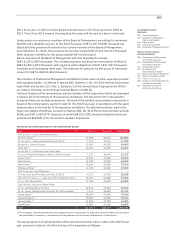
EUR million 2011
Reporting segments Automotive Motorcycles Reconciliation Audi Group
Revenue with external third parties 44,096 – – 44,096
Revenue with other segments ––––
Revenue 44,096 – – 44,096
Depreciation 1,700 – – 1,700
Impairment losses 93 – – 93
Reversal of impairment losses ––––
Segment profit (operating profit) 5,348 – – 5,348
Result from investments accounted
for using the equity method 270 – – 270
Net interest and other financial results 423 – – 423
Investments accounted
for using the equity method 460 – – 460
Investments in property, plant and
equipment and intangible assets 2,862 – – 2,862
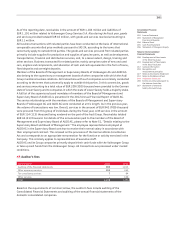
Reconciliation statement
EUR million 2012
Segment revenue 48,771
Consolidation – 0
Group revenue 48,771
Segment profit (operating profit) 5,380
Consolidation –
Operating profit 5,380
Financial result 576
Group profit before tax 5,956
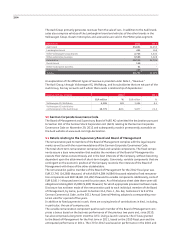
Revenue is allocated to the regions on the basis of the country of destination principle.
By region 2012
EUR million 2012
Germany
Rest of
Europe
Asia-
Pacific
North
America
South
America Africa Total
Revenue with external
third parties 10,373 15,653 15,160 6,641 489 454 48,771
Property, plant and
equipment and
intangible assets 6,921 4,635 154 52 1 – 11,763
By region 2011
EUR million 2011
Germany
Rest of
Europe
Asia-
Pacific
North
America
South
America Africa Total
Revenue with external
third parties 9,212 16,814 12,127 5,003 550 389 44,096
Property, plant and
equipment and
intangible assets 7,296 1,800 111 47 0 – 9,254