Audi 2012 Annual Report Download - page 148
Download and view the complete annual report
Please find page 148 of the 2012 Audi annual report below. You can navigate through the pages in the report by either clicking on the pages listed below, or by using the keyword search tool below to find specific information within the annual report.-
 1
1 -
2
-
3
-
4
-
5
-
6
-
7
-
8
-
9
-
10
-
11
-
12
-
13
-
14
-
15
-
16
-
17
-
18
-
19
-
20
-
21
-
22
-
23
-
24
-
25
-
26
-
27
-
28
-
29
-
30
-
31
-
32
-
33
-
34
-
35
-
36
-
37
-
38
-
39
-
40
-
41
-
42
-
43
-
44
-
45
-
46
-
47
-
48
-
49
-
50
-
51
-
52
-
53
-
54
-
55
-
56
-
57
-
58
-
59
-
60
-
61
-
62
-
63
-
64
-
65
-
66
-
67
-
68
-
69
-
70
-
71
-
72
-
73
-
74
-
75
-
76
-
77
-
78
-
79
-
80
-
81
-
82
-
83
-
84
-
85
-
86
-
87
-
88
-
89
-
90
-
91
-
92
-
93
-
94
-
95
-
96
-
97
-
98
-
99
-
100
-
101
-
102
-
103
-
104
-
105
-
106
-
107
-
108
-
109
-
110
-
111
-
112
-
113
-
114
-
115
-
116
-
117
-
118
-
119
-
120
-
121
-
122
-
123
-
124
-
125
-
126
-
127
-
128
-
129
-
130
-
131
-
132
-
133
-
134
-
135
-
136
-
137
-
 138
138 -
 139
139 -
 140
140 -
 141
141 -
 142
142 -
 143
143 -
 144
144 -
 145
145 -
 146
146 -
 147
147 -
 148
148 -
 149
149 -
 150
150 -
 151
151 -
 152
152 -
 153
153 -
 154
154 -
 155
155 -
 156
156 -
 157
157 -
 158
158 -
159
-
160
-
161
-
162
-
163
-
164
-
165
-
166
-
167
-
168
-
169
-
170
-
171
-
172
-
173
-
174
-
175
-
176
-
177
-
178
-
179
-
180
-
181
-
182
-
183
-
184
-
185
-
186
-
187
-
188
-
189
-
190
-
191
-
192
-
193
-
194
-
195
-
196
-
197
-
198
-
199
-
200
-
201
-
202
-
203
-
204
-
205
-
206
-
207
-
208
-
209
-
210
-
211
-
212
-
213
-
214
-
215
-
216
-
217
-
218
-
219
-
220
-
221
-
222
-
223
-
224
-
225
-
226
-
227
-
228
-
229
-
230
-
231
-
232
-
233
-
234
-
235
-
236
-
237
-
238
-
239
-
240
-
241
-
242
-
243
-
244
-
245
-
246
-
247
-
248
-
249
-
250
-
251
-
252
-
253
-
254
-
255
-
256
-
257
-
258
-
259
-
260
-
261
-
262
-
263
-
264
-
265
-
266
-
267
-
268
-
269
-
270
-
271
-
272
-
273
-
274
-
275
-
276
-
277
-
278
-
279
-
280
-
281
-
282
-
283
-
284
-
285
 |
 |

151
Management Report
140 Audi Group
140 Structure
142 Strategy
148 Shares
149 Disclosures required under
takeover law
150 System of remuneration for
the Supervisory Board and
Board of Management
151 Corporate management
declaration
151 Business and underlying
situation
151 Economic environment
153 Research and development
162 Procurement
162 Production
165 Deliveries and distribution
173 Financial performance
indicators
176 Social and ecological aspects
190 Risks, opportunities
and outlook
201 Disclaimer
CORPORATE MANAGEMENT DECLARATION
The corporate management declaration pursuant to Section 289a of the German Commercial
Code (HGB) is permanently available on the Internet at www.audi.com/corporate-management.
BUSINESS AND UNDERLYING SITUATION
ECONOMIC ENVIRONMENT
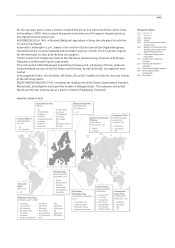
Global economic situation
The global economy’s growth slowed in the year under review, with the growth rate dropping to
2.6 (3.0) percent. Structural challenges mainly in the shape of high levels of public debt damped
growth in many industrial nations. By contrast, gross domestic product in most emerging econ-
omies again enjoyed above-average growth, though this was less vigorous than in the previous
year. Despite the expansionary monetary policy of many central banks, average inflation over the
year remained at a moderate level.
In Western Europe, economic growth was negative at – 0.2 (1.5) percent as a result of the con-
tinuing sovereign debt crises and the related budgetary consolidation efforts. In particular the
Southern European members of the EU, but also individual EU countries in Northern Europe, saw
negative growth. In tandem with these developments, unemployment in Western Europe rose
to 10.7 (9.8) percent on average, with much higher levels in Ireland, Portugal, Spain and
Greece.
As the year progressed, the difficult situation in Western Europe increasingly spilled over into the
German economy, ultimately causing a decline in GDP growth to 0.9 (3.1) percent. Consumer
spending helped to stabilize the situation, above all thanks to the healthy state of the German
labor market and the wage increases during the year under review.
In Central and Eastern Europe, economic development exhibited a slowdown over the past year.
Russia’s gross domestic product likewise showed a slightly slower rate of growth than in the
previous year, with the growth rate reaching 3.4 (4.3) percent.
On the back of the U.S. Federal Reserve’s expansionary monetary policy, the United States achieved
moderate economic growth of 2.2 (1.8) percent in 2012. The labor market nevertheless remained
difficult and domestic demand was subdued.
Most Latin American countries experienced slower growth than one year earlier. Both Brazil and
Argentina saw their economic output rise much more slowly, by 1.0 (2.7) and 1.7 (8.9) percent
respectively.
By contrast, Asia’s emerging markets were again among the powerhouses of the global economy
in 2012 despite their lower growth momentum. The growth rate for gross domestic product in
China reached 7.8 (9.3) percent, ahead of the government target of 7.5 percent but below the
previous year’s high figure. The Indian economy, too, expanded slightly more slowly than in the
previous year, at a rate of 5.1 (6.9) percent.
Japan’s gross domestic product grew by 2.0 (– 0.5) percent as the domestic economy recovered
from the consequences of the natural disaster in 2011.
International car market
Even though global economic growth was only moderate in 2012, demand for cars worldwide
showed a marked upward trend, gaining 7.2 percent to reach a new all-time record of
66.6 (62.1) million passenger cars. All sales regions apart from Western Europe achieved growth.
Growth rates in the Asia-Pacific and North America regions even reached double figures.
In Western Europe (excluding Germany) the continuing sovereign debt crises and economic
slackness were behind a renewed fall in registrations of new cars. In many countries the market
development was adversely affected in particular by a lack of consumer confidence and rising
unemployment. In Western Europe’s major car markets, Spain and France suffered a drastic
decline in sales, contracting by 13.4 and 14.1 percent respectively. In Italy, sales of passenger
cars fell by 19.9 percent. On the other hand, high consumer demand in the UK led to a 5.3 percent
rise in new registrations. Demand for cars in Western Europe as a whole (excluding Germany)
fell by 9.9 percent to 8.7 (9.6) million vehicles – the lowest overall market volume since 1993.