Audi 2012 Annual Report Download - page 232
Download and view the complete annual report
Please find page 232 of the 2012 Audi annual report below. You can navigate through the pages in the report by either clicking on the pages listed below, or by using the keyword search tool below to find specific information within the annual report.-
 1
1 -
2
-
3
-
4
-
5
-
6
-
7
-
8
-
9
-
10
-
11
-
12
-
13
-
14
-
15
-
16
-
17
-
18
-
19
-
20
-
21
-
22
-
23
-
24
-
25
-
26
-
27
-
28
-
29
-
30
-
31
-
32
-
33
-
34
-
35
-
36
-
37
-
38
-
39
-
40
-
41
-
42
-
43
-
44
-
45
-
46
-
47
-
48
-
49
-
50
-
51
-
52
-
53
-
54
-
55
-
56
-
57
-
58
-
59
-
60
-
61
-
62
-
63
-
64
-
65
-
66
-
67
-
68
-
69
-
70
-
71
-
72
-
73
-
74
-
75
-
76
-
77
-
78
-
79
-
80
-
81
-
82
-
83
-
84
-
85
-
86
-
87
-
88
-
89
-
90
-
91
-
92
-
93
-
94
-
95
-
96
-
97
-
98
-
99
-
100
-
101
-
102
-
103
-
104
-
105
-
106
-
107
-
108
-
109
-
110
-
111
-
112
-
113
-
114
-
115
-
116
-
117
-
118
-
119
-
120
-
121
-
122
-
123
-
124
-
125
-
126
-
127
-
128
-
129
-
130
-
131
-
132
-
133
-
134
-
135
-
136
-
137
-
138
-
139
-
140
-
141
-
142
-
143
-
144
-
145
-
146
-
147
-
148
-
149
-
150
-
151
-
152
-
153
-
154
-
155
-
156
-
157
-
158
-
159
-
160
-
161
-
162
-
163
-
164
-
165
-
166
-
167
-
168
-
169
-
170
-
171
-
172
-
173
-
174
-
175
-
176
-
177
-
178
-
179
-
180
-
181
-
182
-
183
-
184
-
185
-
186
-
187
-
188
-
189
-
190
-
191
-
192
-
193
-
194
-
195
-
196
-
197
-
198
-
199
-
200
-
201
-
202
-
203
-
204
-
205
-
206
-
207
-
208
-
209
-
210
-
211
-
212
-
213
-
214
-
215
-
216
-
217
-
218
-
219
-
220
-
221
-
 222
222 -
 223
223 -
 224
224 -
 225
225 -
 226
226 -
 227
227 -
 228
228 -
 229
229 -
 230
230 -
 231
231 -
 232
232 -
 233
233 -
 234
234 -
 235
235 -
 236
236 -
 237
237 -
 238
238 -
 239
239 -
 240
240 -
 241
241 -
 242
242 -
243
-
244
-
245
-
246
-
247
-
248
-
249
-
250
-
251
-
252
-
253
-
254
-
255
-
256
-
257
-
258
-
259
-
260
-
261
-
262
-
263
-
264
-
265
-
266
-
267
-
268
-
269
-
270
-
271
-
272
-
273
-
274
-
275
-
276
-
277
-
278
-
279
-
280
-
281
-
282
-
283
-
284
-
285
 |
 |

235
Consolidated Financial
Statements
202 Income Statement
203 Statement of Recognized
Income and Expense
204 Balance Sheet
205 Cash Flow Statement
206 Statement of Changes in Equity
Notes to the Consolidated
Financial Statements
208 Development of fixed assets
in the 2012 fiscal year
210 Development of fixed assets
in the 2011 fiscal year
212 General information
218 Recognition and
measurement principles
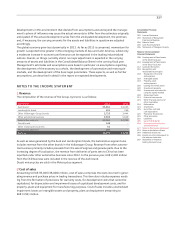
227 Notes to the Income Statement
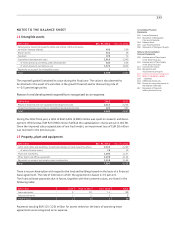
233 Notes to the Balance Sheet
238 Liabilities
244 Additional disclosures
266 Events occurring subsequent to
the balance sheet date
267 Statement of Interests
held by the Audi Group
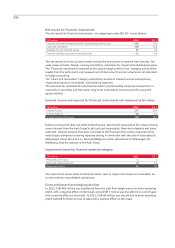
19 Deferred tax assets
The temporary differences between tax bases and carrying amounts in the Consolidated Financial
Statements are explained under “Deferred tax” in the “Recognition and measurement principles,”
and under Note 10, “Income tax expense.”
20 Other financial assets
The financial assets reported in previous years under “Other receivables and financial assets” are
presented in more detail in both the current and non-current areas for the 2012 fiscal year. The
prior year’s figures have been broken down accordingly.
Non-current other financial assets
EUR million Dec. 31, 2012 Dec. 31, 2011
Positive fair values from derivative financial instruments 464 236
of which to affiliated companies 407 152
Fixed deposits and loans extended 171 131
of which to affiliated companies 170 130
Miscellaneous financial assets 27 24
Total 662 391
With regard to fixed deposits and loans extended, as well as other non-current financial assets, the
fair values for 2012 correspond to the carrying amounts. The fixed deposits and loans extended
accrue interest at rates of interest of up to 4.5 (4.5) percent.
Derivative financial instruments are measured at market value. The total position in relation to
hedging instruments is presented under Note 37.5, “Methods of monitoring the effectiveness of
hedging relationships.”
Current other financial assets
EUR million Dec. 31, 2012 Dec. 31, 2011
Positive fair values from derivative financial instruments 205 97
of which to affiliated companies 162 90
Fixed deposits and loans extended 1,560 6,697
of which to affiliated companies 1,559 6,671
Miscellaneous financial assets 538 240
of which to affiliated companies 408 169
Total 2,303 7,033
The carrying amounts correspond to the fair values.
The positive fair values of current and non-current derivative financial instruments are com-
posed as follows:
EUR million Dec. 31, 2012 Dec. 31, 2011
Cash flow hedges to hedge against
currency risks from future payment streams 518 137
commodity price risks from future payment streams 23 38
Other derivative financial instruments 128 157
Positive fair values of derivative financial instruments 669 332