Audi 2012 Annual Report Download - page 233
Download and view the complete annual report
Please find page 233 of the 2012 Audi annual report below. You can navigate through the pages in the report by either clicking on the pages listed below, or by using the keyword search tool below to find specific information within the annual report.-
 1
1 -
2
-
3
-
4
-
5
-
6
-
7
-
8
-
9
-
10
-
11
-
12
-
13
-
14
-
15
-
16
-
17
-
18
-
19
-
20
-
21
-
22
-
23
-
24
-
25
-
26
-
27
-
28
-
29
-
30
-
31
-
32
-
33
-
34
-
35
-
36
-
37
-
38
-
39
-
40
-
41
-
42
-
43
-
44
-
45
-
46
-
47
-
48
-
49
-
50
-
51
-
52
-
53
-
54
-
55
-
56
-
57
-
58
-
59
-
60
-
61
-
62
-
63
-
64
-
65
-
66
-
67
-
68
-
69
-
70
-
71
-
72
-
73
-
74
-
75
-
76
-
77
-
78
-
79
-
80
-
81
-
82
-
83
-
84
-
85
-
86
-
87
-
88
-
89
-
90
-
91
-
92
-
93
-
94
-
95
-
96
-
97
-
98
-
99
-
100
-
101
-
102
-
103
-
104
-
105
-
106
-
107
-
108
-
109
-
110
-
111
-
112
-
113
-
114
-
115
-
116
-
117
-
118
-
119
-
120
-
121
-
122
-
123
-
124
-
125
-
126
-
127
-
128
-
129
-
130
-
131
-
132
-
133
-
134
-
135
-
136
-
137
-
138
-
139
-
140
-
141
-
142
-
143
-
144
-
145
-
146
-
147
-
148
-
149
-
150
-
151
-
152
-
153
-
154
-
155
-
156
-
157
-
158
-
159
-
160
-
161
-
162
-
163
-
164
-
165
-
166
-
167
-
168
-
169
-
170
-
171
-
172
-
173
-
174
-
175
-
176
-
177
-
178
-
179
-
180
-
181
-
182
-
183
-
184
-
185
-
186
-
187
-
188
-
189
-
190
-
191
-
192
-
193
-
194
-
195
-
196
-
197
-
198
-
199
-
200
-
201
-
202
-
203
-
204
-
205
-
206
-
207
-
208
-
209
-
210
-
211
-
212
-
213
-
214
-
215
-
216
-
217
-
218
-
219
-
220
-
221
-
222
-
 223
223 -
 224
224 -
 225
225 -
 226
226 -
 227
227 -
 228
228 -
 229
229 -
 230
230 -
 231
231 -
 232
232 -
 233
233 -
 234
234 -
 235
235 -
 236
236 -
 237
237 -
 238
238 -
 239
239 -
 240
240 -
 241
241 -
 242
242 -
 243
243 -
244
-
245
-
246
-
247
-
248
-
249
-
250
-
251
-
252
-
253
-
254
-
255
-
256
-
257
-
258
-
259
-
260
-
261
-
262
-
263
-
264
-
265
-
266
-
267
-
268
-
269
-
270
-
271
-
272
-
273
-
274
-
275
-
276
-
277
-
278
-
279
-
280
-
281
-
282
-
283
-
284
-
285
 |
 |

236
21 Other receivables
Non-current other receivables
EUR million Dec. 31, 2012 Dec. 31, 2011
Tax claims 2 2
Miscellaneous receivables 11 19
Total 13 21
Current other receivables
EUR million Dec. 31, 2012 Dec. 31, 2011
Tax claims 246 157
Miscellaneous receivables 204 116
Total 451 273
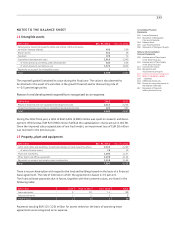
22 Inventories
EUR million Dec. 31, 2012 Dec. 31, 2011
Raw materials and supplies 417 433
Work in progress 570 463
Finished goods and merchandise 2,750 2,832
Current leased assets 594 650
Total 4,331 4,377
Inventories amounting to EUR 35,467 (32,697) million were recorded as cost of sales at the
same time that the revenue from them was realized.
EUR 1,092 (1,008) million of the total inventories was capitalized at the net realizable value.
The impairment resulting from the measurement of inventories on the basis of sales markets
amounted to EUR 76 (65) million.
No reversals of impairment losses were performed in the fiscal year.
Of the finished goods inventory, a portion of the company car fleet valued at EUR 260 (227)
million has been pledged as collateral for commitments toward employees, under the partial
retirement block model. The other reported inventories are not subject to any significant restric-
tions on ownership or disposal.
Leased vehicles with an operating lease term of up to one year were reported under inventories
in the amount of EUR 594 (650) million. In the 2013 fiscal year, payments in the amount of
EUR 43 million are expected from irrevocable leasing relationships.
23 Trade receivables
EUR million Dec. 31, 2012 Dec. 31, 2011
Trade receivables from
third parties 1,145 1,421
affiliated companies 684 1,060
associated companies and participating interests 423 529
Total 2,251 3,009
The carrying amounts of the trade receivables correspond to the fair values due to their short-
term nature.
All receivables will be realized within the next 12 months. Impairment losses on trade
receivables are detailed under Note 37.2, “Credit risks.”