Audi 2012 Annual Report Download - page 243
Download and view the complete annual report
Please find page 243 of the 2012 Audi annual report below. You can navigate through the pages in the report by either clicking on the pages listed below, or by using the keyword search tool below to find specific information within the annual report.-
 1
1 -
2
-
3
-
4
-
5
-
6
-
7
-
8
-
9
-
10
-
11
-
12
-
13
-
14
-
15
-
16
-
17
-
18
-
19
-
20
-
21
-
22
-
23
-
24
-
25
-
26
-
27
-
28
-
29
-
30
-
31
-
32
-
33
-
34
-
35
-
36
-
37
-
38
-
39
-
40
-
41
-
42
-
43
-
44
-
45
-
46
-
47
-
48
-
49
-
50
-
51
-
52
-
53
-
54
-
55
-
56
-
57
-
58
-
59
-
60
-
61
-
62
-
63
-
64
-
65
-
66
-
67
-
68
-
69
-
70
-
71
-
72
-
73
-
74
-
75
-
76
-
77
-
78
-
79
-
80
-
81
-
82
-
83
-
84
-
85
-
86
-
87
-
88
-
89
-
90
-
91
-
92
-
93
-
94
-
95
-
96
-
97
-
98
-
99
-
100
-
101
-
102
-
103
-
104
-
105
-
106
-
107
-
108
-
109
-
110
-
111
-
112
-
113
-
114
-
115
-
116
-
117
-
118
-
119
-
120
-
121
-
122
-
123
-
124
-
125
-
126
-
127
-
128
-
129
-
130
-
131
-
132
-
133
-
134
-
135
-
136
-
137
-
138
-
139
-
140
-
141
-
142
-
143
-
144
-
145
-
146
-
147
-
148
-
149
-
150
-
151
-
152
-
153
-
154
-
155
-
156
-
157
-
158
-
159
-
160
-
161
-
162
-
163
-
164
-
165
-
166
-
167
-
168
-
169
-
170
-
171
-
172
-
173
-
174
-
175
-
176
-
177
-
178
-
179
-
180
-
181
-
182
-
183
-
184
-
185
-
186
-
187
-
188
-
189
-
190
-
191
-
192
-
193
-
194
-
195
-
196
-
197
-
198
-
199
-
200
-
201
-
202
-
203
-
204
-
205
-
206
-
207
-
208
-
209
-
210
-
211
-
212
-
213
-
214
-
215
-
216
-
217
-
218
-
219
-
220
-
221
-
222
-
223
-
224
-
225
-
226
-
227
-
228
-
229
-
230
-
231
-
232
-
 233
233 -
 234
234 -
 235
235 -
 236
236 -
 237
237 -
 238
238 -
 239
239 -
 240
240 -
 241
241 -
 242
242 -
 243
243 -
 244
244 -
 245
245 -
 246
246 -
 247
247 -
 248
248 -
 249
249 -
 250
250 -
 251
251 -
 252
252 -
 253
253 -
254
-
255
-
256
-
257
-
258
-
259
-
260
-
261
-
262
-
263
-
264
-
265
-
266
-
267
-
268
-
269
-
270
-
271
-
272
-
273
-
274
-
275
-
276
-
277
-
278
-
279
-
280
-
281
-
282
-
283
-
284
-
285
 |
 |

246
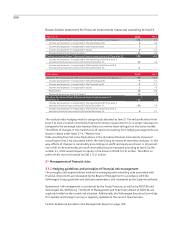
The following table presents a reconciliation of the carrying amounts of the Balance Sheet items with the individual IFRS 7
categories:
Carrying amounts of financial instruments as of December 31, 2012
EUR million
Carrying amount as
per Balance Sheet as
of Dec. 31, 2012
Measured at fair
value through
profit or loss
Available
for sale
Loans and
receivables
ASSETS
Non-current
Other long-term investments 254 –254 –
Other financial assets 1) 662
of which from the positive fair values of
derivative financial instruments 464 71 – –
of which fixed deposits and extended loans 171 –– 171
of which other financial assets 27 –– 27
Current
Trade receivables 2,251 –– 2,251
Other financial assets 1) 2,303
of which from the positive fair values of
derivative financial instruments 205 57 – –
of which fixed deposits and extended loans 1,560 –– 1,560
of which other financial assets 538 –– 535
Securities 1,807 –1,807 –
Cash and cash equivalents 11,170 –– 11,170
Total financial assets 18,449 128 2,062 15,715
LIABILITIES AND SHAREHOLDERS’ EQUITY
Non-current
Financial liabilities 145
of which liabilities from financial lease agreements 129 –– –
of which other financial liabilities 16 –– –
Other financial liabilities 244
of which from the negative fair values of
derivative financial instruments 218 35 – –
of which other financial liabilities 26 –– –
Current
Financial liabilities 1,168
of which liabilities from financial lease agreements 7–– –
of which other financial liabilities 1,161 –– –
Trade payables 4,270 –– –
Other financial liabilities 4,485
of which from the negative fair values of
derivative financial instruments 259 36 – –
of which other financial liabilities 4,226 –– –
Total financial liabilities 10,312 71 – –
1) The financial assets reported in previous years under “Other receivables and financial assets” are presented separately in both the current and non-current
areas for the 2012 fiscal year. Other receivables that are not financial instruments are no longer contained in the above table. The prior year’s figures have
been adjusted accordingly.
2) The financial liabilities reported in previous years under “Other liabilities” are presented separately in both the current and non-current areas for the 2012
fiscal year. The prior year’s figures have been broken down accordingly. Other liabilities that are not financial instruments are no longer contained in the above
table. The prior year’s figures have been adjusted accordingly.