Audi 2012 Annual Report Download - page 238
Download and view the complete annual report
Please find page 238 of the 2012 Audi annual report below. You can navigate through the pages in the report by either clicking on the pages listed below, or by using the keyword search tool below to find specific information within the annual report.-
 1
1 -
2
-
3
-
4
-
5
-
6
-
7
-
8
-
9
-
10
-
11
-
12
-
13
-
14
-
15
-
16
-
17
-
18
-
19
-
20
-
21
-
22
-
23
-
24
-
25
-
26
-
27
-
28
-
29
-
30
-
31
-
32
-
33
-
34
-
35
-
36
-
37
-
38
-
39
-
40
-
41
-
42
-
43
-
44
-
45
-
46
-
47
-
48
-
49
-
50
-
51
-
52
-
53
-
54
-
55
-
56
-
57
-
58
-
59
-
60
-
61
-
62
-
63
-
64
-
65
-
66
-
67
-
68
-
69
-
70
-
71
-
72
-
73
-
74
-
75
-
76
-
77
-
78
-
79
-
80
-
81
-
82
-
83
-
84
-
85
-
86
-
87
-
88
-
89
-
90
-
91
-
92
-
93
-
94
-
95
-
96
-
97
-
98
-
99
-
100
-
101
-
102
-
103
-
104
-
105
-
106
-
107
-
108
-
109
-
110
-
111
-
112
-
113
-
114
-
115
-
116
-
117
-
118
-
119
-
120
-
121
-
122
-
123
-
124
-
125
-
126
-
127
-
128
-
129
-
130
-
131
-
132
-
133
-
134
-
135
-
136
-
137
-
138
-
139
-
140
-
141
-
142
-
143
-
144
-
145
-
146
-
147
-
148
-
149
-
150
-
151
-
152
-
153
-
154
-
155
-
156
-
157
-
158
-
159
-
160
-
161
-
162
-
163
-
164
-
165
-
166
-
167
-
168
-
169
-
170
-
171
-
172
-
173
-
174
-
175
-
176
-
177
-
178
-
179
-
180
-
181
-
182
-
183
-
184
-
185
-
186
-
187
-
188
-
189
-
190
-
191
-
192
-
193
-
194
-
195
-
196
-
197
-
198
-
199
-
200
-
201
-
202
-
203
-
204
-
205
-
206
-
207
-
208
-
209
-
210
-
211
-
212
-
213
-
214
-
215
-
216
-
217
-
218
-
219
-
220
-
221
-
222
-
223
-
224
-
225
-
226
-
227
-
 228
228 -
 229
229 -
 230
230 -
 231
231 -
 232
232 -
 233
233 -
 234
234 -
 235
235 -
 236
236 -
 237
237 -
 238
238 -
 239
239 -
 240
240 -
 241
241 -
 242
242 -
 243
243 -
 244
244 -
 245
245 -
 246
246 -
 247
247 -
 248
248 -
249
-
250
-
251
-
252
-
253
-
254
-
255
-
256
-
257
-
258
-
259
-
260
-
261
-
262
-
263
-
264
-
265
-
266
-
267
-
268
-
269
-
270
-
271
-
272
-
273
-
274
-
275
-
276
-
277
-
278
-
279
-
280
-
281
-
282
-
283
-
284
-
285
 |
 |

241
Consolidated Financial
Statements
202 Income Statement
203 Statement of Recognized
Income and Expense
204 Balance Sheet
205 Cash Flow Statement
206 Statement of Changes in Equity
Notes to the Consolidated
Financial Statements
208 Development of fixed assets
in the 2012 fiscal year
210 Development of fixed assets
in the 2011 fiscal year
212 General information
218 Recognition and
measurement principles
227 Notes to the Income Statement
233 Notes to the Balance Sheet
238 Liabilities
244 Additional disclosures
266 Events occurring subsequent to
the balance sheet date
267 Statement of Interests
held by the Audi Group
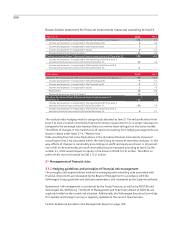
The present value of the defined benefit obligations changed as follows:
EUR million 2012 2011
Present value on January 1 3,218 3,001
Changes in the group of consolidated companies and
first-time adoption of IAS 19 61
Service cost 106 79
Interest cost 141 141
Actuarial gains (–)/losses (+) + 938 + 92
Pension payments from company assets – 95 – 92
Pension payments from fund assets – 5– 4
Effects from transfers 4 – 1
Currency differences – 11
Present value on December 31 4,314 3,218
The reconciliation for the fair value of the plan assets is as follows:
EUR million 2012 2011
Plan assets on January 1 714 670
Changes in the group of consolidated companies and
first-time adoption of IAS 19 1–
Expected return on plan assets 28 29
Actuarial gains (+)/losses (–) 8 – 51
Employer contributions 97 69
Benefits paid – 5– 4
Effects of transfers 10
Plan assets on December 31 844 714
In the 2012 fiscal year, actual gains from the plan assets amounted to EUR 36 million. In the
2011 fiscal year, actual losses from the plan assets amounted to EUR 21 million.
The long-term overall yield on the plan assets is determined on a uniform basis and depends on
the actual long-term earnings of the portfolio, historical overall market yields, and a forecast of
the anticipated yields of the classes of security in the portfolio.
Employer contributions to the fund assets totaling EUR 88 (70) million are expected for the
following fiscal year.
The composition of fund assets is as follows, by category:
as % of fund assets 2012 2011
Shares 28.4 28.6
Fixed-income securities 55.3 62.2
Cash 11.7 4.4
Real estate 2.5 2.6
Other 2.1 2.2
Total 100.0 100.0
Actuarial gains and losses result from changes in the entitlement base and from deviations in
the actual trends (e.g. increases in pay or retirement benefits) from the figures assumed for
calculation purposes. In accordance with the requirements of IAS 19, such gains and losses are
recognized without affecting income under a separate line item within equity, taking deferred
tax into account.