Audi 2012 Annual Report Download - page 248
Download and view the complete annual report
Please find page 248 of the 2012 Audi annual report below. You can navigate through the pages in the report by either clicking on the pages listed below, or by using the keyword search tool below to find specific information within the annual report.-
 1
1 -
2
-
3
-
4
-
5
-
6
-
7
-
8
-
9
-
10
-
11
-
12
-
13
-
14
-
15
-
16
-
17
-
18
-
19
-
20
-
21
-
22
-
23
-
24
-
25
-
26
-
27
-
28
-
29
-
30
-
31
-
32
-
33
-
34
-
35
-
36
-
37
-
38
-
39
-
40
-
41
-
42
-
43
-
44
-
45
-
46
-
47
-
48
-
49
-
50
-
51
-
52
-
53
-
54
-
55
-
56
-
57
-
58
-
59
-
60
-
61
-
62
-
63
-
64
-
65
-
66
-
67
-
68
-
69
-
70
-
71
-
72
-
73
-
74
-
75
-
76
-
77
-
78
-
79
-
80
-
81
-
82
-
83
-
84
-
85
-
86
-
87
-
88
-
89
-
90
-
91
-
92
-
93
-
94
-
95
-
96
-
97
-
98
-
99
-
100
-
101
-
102
-
103
-
104
-
105
-
106
-
107
-
108
-
109
-
110
-
111
-
112
-
113
-
114
-
115
-
116
-
117
-
118
-
119
-
120
-
121
-
122
-
123
-
124
-
125
-
126
-
127
-
128
-
129
-
130
-
131
-
132
-
133
-
134
-
135
-
136
-
137
-
138
-
139
-
140
-
141
-
142
-
143
-
144
-
145
-
146
-
147
-
148
-
149
-
150
-
151
-
152
-
153
-
154
-
155
-
156
-
157
-
158
-
159
-
160
-
161
-
162
-
163
-
164
-
165
-
166
-
167
-
168
-
169
-
170
-
171
-
172
-
173
-
174
-
175
-
176
-
177
-
178
-
179
-
180
-
181
-
182
-
183
-
184
-
185
-
186
-
187
-
188
-
189
-
190
-
191
-
192
-
193
-
194
-
195
-
196
-
197
-
198
-
199
-
200
-
201
-
202
-
203
-
204
-
205
-
206
-
207
-
208
-
209
-
210
-
211
-
212
-
213
-
214
-
215
-
216
-
217
-
218
-
219
-
220
-
221
-
222
-
223
-
224
-
225
-
226
-
227
-
228
-
229
-
230
-
231
-
232
-
233
-
234
-
235
-
236
-
237
-
 238
238 -
 239
239 -
 240
240 -
 241
241 -
 242
242 -
 243
243 -
 244
244 -
 245
245 -
 246
246 -
 247
247 -
 248
248 -
 249
249 -
 250
250 -
 251
251 -
 252
252 -
 253
253 -
 254
254 -
 255
255 -
 256
256 -
 257
257 -
 258
258 -
259
-
260
-
261
-
262
-
263
-
264
-
265
-
266
-
267
-
268
-
269
-
270
-
271
-
272
-
273
-
274
-
275
-
276
-
277
-
278
-
279
-
280
-
281
-
282
-
283
-
284
-
285
 |
 |

251
Consolidated Financial
Statements
202 Income Statement
203 Statement of Recognized
Income and Expense
204 Balance Sheet
205 Cash Flow Statement
206 Statement of Changes in Equity
Notes to the Consolidated
Financial Statements
208 Development of fixed assets
in the 2012 fiscal year
210 Development of fixed assets
in the 2011 fiscal year
212 General information
218 Recognition and
measurement principles
227 Notes to the Income Statement
233 Notes to the Balance Sheet
244 Additional disclosures
266 Events occurring subsequent to
the balance sheet date
267 Statement of Interests
held by the Audi Group
37.2 Credit risks
Credit risks from financial assets comprise the risk of default by a contractual party and there-
fore do not exceed the positive fair values in respect of the contractual party in question. The
risk from non-derivative financial instruments is covered by value adjustments for loss of recei-
vables. The contractual partners for cash and capital investments, as well as currency and raw
materials hedging instruments, have impeccable credit standings. Over and above this, the risks
are restricted by a limit system that is based on the credit ratings of international rating agen-
cies and the equity base of the contractual parties.
The Group’s global business operations and resulting diversification meant that there were no
major risk concentrations during the past fiscal year.
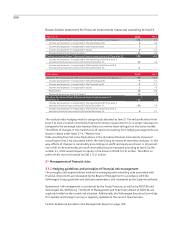
The credit quality of financial assets measured at amortized cost is shown in the following table:
EUR million
Gross carrying
amount as of
Dec. 31, 2012
Neither past
due nor
impaired
Past due and
not impaired Impaired
Measured at amortized cost
Trade receivables 2,313 1,388 859 66
Other receivables 2,345 2,274 22 49
of which receivables from loans 1,731 1,731 0–
of which miscellaneous receivables 614 543 22 49
Total 4,658 3,663 881 115
EUR million
Gross carrying
amount as of
Dec. 31, 2011
Neither past
due nor
impaired
Past due and
not impaired Impaired
Measured at amortized cost
Trade receivables 3,059 2,459 533 67
Other receivables 7,138 7,027 61 50
of which receivables from loans 6,827 6,827 ––
of which miscellaneous receivables 311 199 61 50
Total 10,197 9,486 594 117
The Audi Group’s trading partners, borrowers and debtors are regularly monitored under the risk
management system. All receivables that are “Neither past due nor impaired,” amounting to
EUR 3,663 (9,486) million, are allocable to risk category 1. Risk category 1 is the highest rating
category within the Volkswagen Group; it exclusively comprises “Receivables owing from cus-
tomers of high creditworthiness.”
Within the Audi Group, there are absolutely no past due financial instruments measured at fair
value. The fair values of these financial instruments are determined based on their market pri-
ces. Specific value adjustments of securities measured at fair value were reversed in the amount
of EUR 4 million in the Audi Group during the 2012 fiscal year.