Audi 2012 Annual Report Download - page 205
Download and view the complete annual report
Please find page 205 of the 2012 Audi annual report below. You can navigate through the pages in the report by either clicking on the pages listed below, or by using the keyword search tool below to find specific information within the annual report.-
 1
1 -
2
-
3
-
4
-
5
-
6
-
7
-
8
-
9
-
10
-
11
-
12
-
13
-
14
-
15
-
16
-
17
-
18
-
19
-
20
-
21
-
22
-
23
-
24
-
25
-
26
-
27
-
28
-
29
-
30
-
31
-
32
-
33
-
34
-
35
-
36
-
37
-
38
-
39
-
40
-
41
-
42
-
43
-
44
-
45
-
46
-
47
-
48
-
49
-
50
-
51
-
52
-
53
-
54
-
55
-
56
-
57
-
58
-
59
-
60
-
61
-
62
-
63
-
64
-
65
-
66
-
67
-
68
-
69
-
70
-
71
-
72
-
73
-
74
-
75
-
76
-
77
-
78
-
79
-
80
-
81
-
82
-
83
-
84
-
85
-
86
-
87
-
88
-
89
-
90
-
91
-
92
-
93
-
94
-
95
-
96
-
97
-
98
-
99
-
100
-
101
-
102
-
103
-
104
-
105
-
106
-
107
-
108
-
109
-
110
-
111
-
112
-
113
-
114
-
115
-
116
-
117
-
118
-
119
-
120
-
121
-
122
-
123
-
124
-
125
-
126
-
127
-
128
-
129
-
130
-
131
-
132
-
133
-
134
-
135
-
136
-
137
-
138
-
139
-
140
-
141
-
142
-
143
-
144
-
145
-
146
-
147
-
148
-
149
-
150
-
151
-
152
-
153
-
154
-
155
-
156
-
157
-
158
-
159
-
160
-
161
-
162
-
163
-
164
-
165
-
166
-
167
-
168
-
169
-
170
-
171
-
172
-
173
-
174
-
175
-
176
-
177
-
178
-
179
-
180
-
181
-
182
-
183
-
184
-
185
-
186
-
187
-
188
-
189
-
190
-
191
-
192
-
193
-
194
-
 195
195 -
 196
196 -
 197
197 -
 198
198 -
 199
199 -
 200
200 -
 201
201 -
 202
202 -
 203
203 -
 204
204 -
 205
205 -
 206
206 -
 207
207 -
 208
208 -
 209
209 -
 210
210 -
 211
211 -
 212
212 -
 213
213 -
 214
214 -
 215
215 -
216
-
217
-
218
-
219
-
220
-
221
-
222
-
223
-
224
-
225
-
226
-
227
-
228
-
229
-
230
-
231
-
232
-
233
-
234
-
235
-
236
-
237
-
238
-
239
-
240
-
241
-
242
-
243
-
244
-
245
-
246
-
247
-
248
-
249
-
250
-
251
-
252
-
253
-
254
-
255
-
256
-
257
-
258
-
259
-
260
-
261
-
262
-
263
-
264
-
265
-
266
-
267
-
268
-
269
-
270
-
271
-
272
-
273
-
274
-
275
-
276
-
277
-
278
-
279
-
280
-
281
-
282
-
283
-
284
-
285
 |
 |
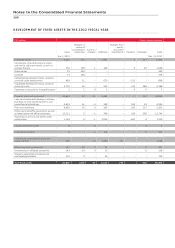
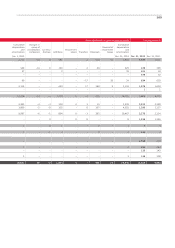
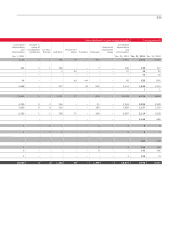
208
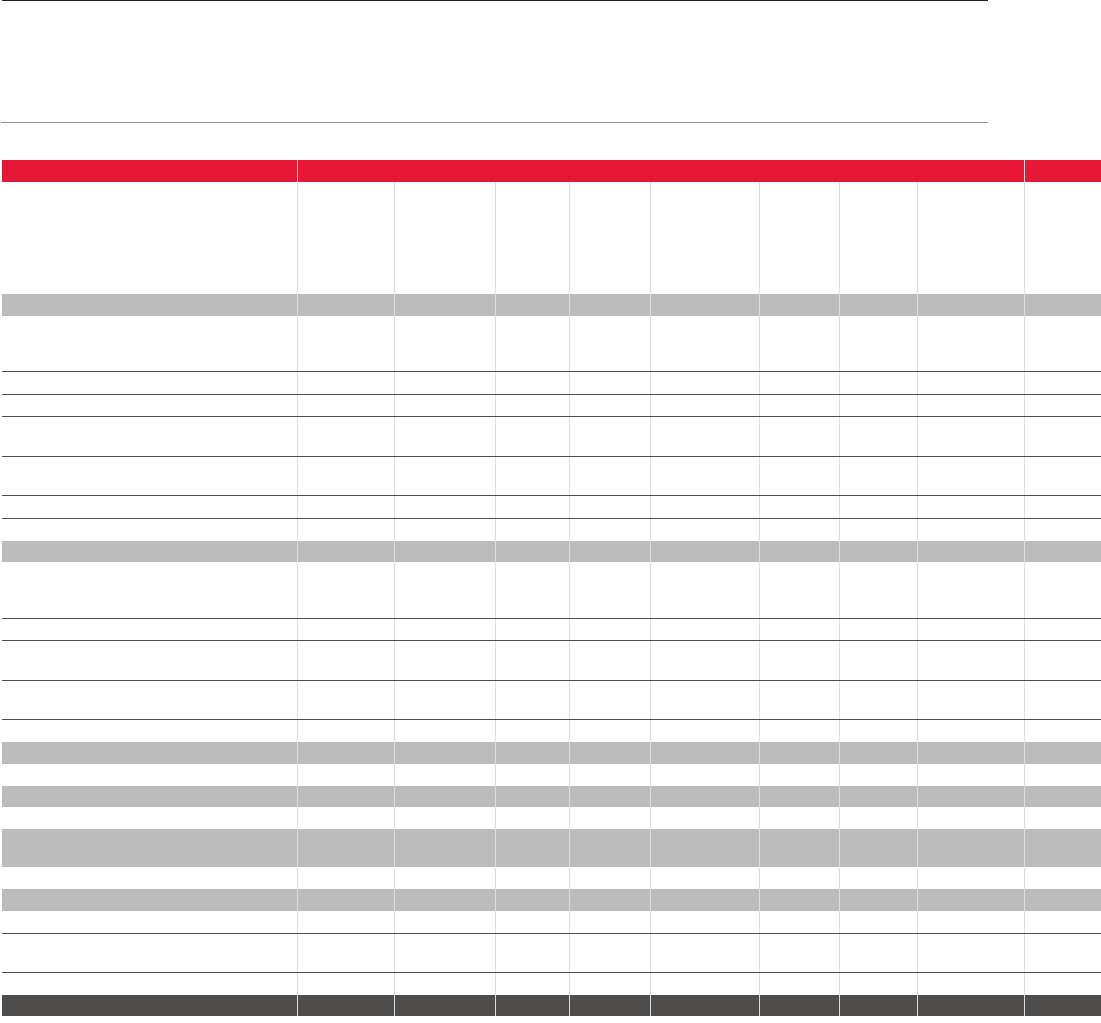
DEVELOPMENT OF FIXED ASSETS IN THE 2012 FISCAL YEAR
EUR million Gross carrying amounts
Costs
Changes in
group of
consolidated
companies
Currency
changes Additions
Changes from
equity-
accounted
investments Transfers Disposals Costs
Jan. 1, 2012 Dec. 31, 2012
Intangible assets 5,281 977 11,074 –7 417 6,921
Concessions, industrial property rights
and similar rights and assets, as well as
licenses thereto 730 199 1149 –9 29 1,058
Brand names 55 404 – – – – –459
Goodwill 72 306 – – – – –378
Capitalized development costs, products
currently under development 689 11 –670 – – 512 –858
Capitalized development costs, products
currently in use 3,735 56 –253 –512 388 4,168
Payments on account for intangible assets 1 1 0 2 – – 3 0 1
Property, plant and equipment 22,824 82 – 11 2,183 – – 7 532 24,540
Land, land rights and buildings, including
buildings on land owned by others, and
leased land and buildings 4,602 41 – 9169 –169 18 4,954
Plant and machinery 4,965 30 0206 –233 112 5,322
Other plant and office equipment, as well
as leased plant and office equipment 12,111 5 – 1789 –238 396 12,745
Payments on account and assets under
construction 1,146 6 – 11,020 – – 647 61,519
Leasing and rental assets 8 – 0 – – – 4 4
Investment property 8 – – 1118 –– 0125
Investments accounted for using the
equity method 460 – – 13 3,000 191 – –3,638
Other long-term investments 247 – 30 041 –– 0257
Investments in affiliated companies 143 – 30 015 –– 0128
Shares in associated companies and
participating interests 103 0 – 26 –– –129
Total fixed assets 28,829 1,029 – 26 6,416 191 – 953 35,486
Notes to the Consolidated Financial Statements