Audi 2012 Annual Report Download - page 229
Download and view the complete annual report
Please find page 229 of the 2012 Audi annual report below. You can navigate through the pages in the report by either clicking on the pages listed below, or by using the keyword search tool below to find specific information within the annual report.-
 1
1 -
2
-
3
-
4
-
5
-
6
-
7
-
8
-
9
-
10
-
11
-
12
-
13
-
14
-
15
-
16
-
17
-
18
-
19
-
20
-
21
-
22
-
23
-
24
-
25
-
26
-
27
-
28
-
29
-
30
-
31
-
32
-
33
-
34
-
35
-
36
-
37
-
38
-
39
-
40
-
41
-
42
-
43
-
44
-
45
-
46
-
47
-
48
-
49
-
50
-
51
-
52
-
53
-
54
-
55
-
56
-
57
-
58
-
59
-
60
-
61
-
62
-
63
-
64
-
65
-
66
-
67
-
68
-
69
-
70
-
71
-
72
-
73
-
74
-
75
-
76
-
77
-
78
-
79
-
80
-
81
-
82
-
83
-
84
-
85
-
86
-
87
-
88
-
89
-
90
-
91
-
92
-
93
-
94
-
95
-
96
-
97
-
98
-
99
-
100
-
101
-
102
-
103
-
104
-
105
-
106
-
107
-
108
-
109
-
110
-
111
-
112
-
113
-
114
-
115
-
116
-
117
-
118
-
119
-
120
-
121
-
122
-
123
-
124
-
125
-
126
-
127
-
128
-
129
-
130
-
131
-
132
-
133
-
134
-
135
-
136
-
137
-
138
-
139
-
140
-
141
-
142
-
143
-
144
-
145
-
146
-
147
-
148
-
149
-
150
-
151
-
152
-
153
-
154
-
155
-
156
-
157
-
158
-
159
-
160
-
161
-
162
-
163
-
164
-
165
-
166
-
167
-
168
-
169
-
170
-
171
-
172
-
173
-
174
-
175
-
176
-
177
-
178
-
179
-
180
-
181
-
182
-
183
-
184
-
185
-
186
-
187
-
188
-
189
-
190
-
191
-
192
-
193
-
194
-
195
-
196
-
197
-
198
-
199
-
200
-
201
-
202
-
203
-
204
-
205
-
206
-
207
-
208
-
209
-
210
-
211
-
212
-
213
-
214
-
215
-
216
-
217
-
218
-
 219
219 -
 220
220 -
 221
221 -
 222
222 -
 223
223 -
 224
224 -
 225
225 -
 226
226 -
 227
227 -
 228
228 -
 229
229 -
 230
230 -
 231
231 -
 232
232 -
 233
233 -
 234
234 -
 235
235 -
 236
236 -
 237
237 -
 238
238 -
 239
239 -
240
-
241
-
242
-
243
-
244
-
245
-
246
-
247
-
248
-
249
-
250
-
251
-
252
-
253
-
254
-
255
-
256
-
257
-
258
-
259
-
260
-
261
-
262
-
263
-
264
-
265
-
266
-
267
-
268
-
269
-
270
-
271
-
272
-
273
-
274
-
275
-
276
-
277
-
278
-
279
-
280
-
281
-
282
-
283
-
284
-
285
 |
 |

232
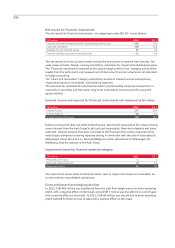
Net results for financial instruments
The net results for financial instruments – as categorized under IAS 39 – are as follows:
EUR million 2012 2011
Financial instruments measured at fair value through profit or loss – 102 134
Loans and receivables 146 250
Available-for-sale financial assets 81 49
Financial liabilities measured at amortized cost – 11 – 16
The net results for financial instruments include the net income or expense from interest, fair
value measurements, foreign currency translation, reductions for impairment and disposal gains.
The “Financial instruments measured at fair value through profit or loss” category presents the
results from the settlement and measurement of derivative financial instruments not allocated
to hedge accounting.
The “Loans and receivables” category essentially consists of interest income and expenses,
impairment losses on receivables, and factoring expenses.
The net result for “available-for-sale financial assets” predominantly comprises income from in-
vestments in securities and from other long-term investments not accounted for using the
equity method.
Interest income and expense for financial instruments not measured at fair value
EUR million 2012 2011
Interest income 157 224
Interest expense – 38 – 43
Interest income and expense 120 181
Interest income that does not relate to the financial instruments measured at fair value primarily
covers interest from the Audi Group’s cash and cash equivalents, fixed-term deposits and loans
extended. Interest expense that does not relate to the financial instruments measured at fair
value largely comprises factoring expenses arising in connection with the sale of receivables to
Volkswagen Group Services S.A., Brussels (Belgium) and to subsidiaries of Volkswagen AG,
Wolfsburg, that are not part of the Audi Group.
Impairment losses for financial assets by category
EUR million 2012 2011
Measured at fair value 1 1
Measured at amortized cost 13 19
Impairment losses 14 20
The impairment losses relate to financial assets, such as impairment losses on receivables, se-
curities and non-consolidated subsidiaries.
Gains and losses from hedging activities
In 2012, EUR 463 million was transferred from the cash flow hedge reserve to other operating
profit, with a negative effect on the result, whilst EUR 7 million was transferred to cost of sales
with a positive effect on the result. In 2011, EUR 49 million was transferred to other operating
profit and EUR 6 million to cost of sales with a positive effect on the result.