Audi 2012 Annual Report Download - page 225
Download and view the complete annual report
Please find page 225 of the 2012 Audi annual report below. You can navigate through the pages in the report by either clicking on the pages listed below, or by using the keyword search tool below to find specific information within the annual report.-
 1
1 -
2
-
3
-
4
-
5
-
6
-
7
-
8
-
9
-
10
-
11
-
12
-
13
-
14
-
15
-
16
-
17
-
18
-
19
-
20
-
21
-
22
-
23
-
24
-
25
-
26
-
27
-
28
-
29
-
30
-
31
-
32
-
33
-
34
-
35
-
36
-
37
-
38
-
39
-
40
-
41
-
42
-
43
-
44
-
45
-
46
-
47
-
48
-
49
-
50
-
51
-
52
-
53
-
54
-
55
-
56
-
57
-
58
-
59
-
60
-
61
-
62
-
63
-
64
-
65
-
66
-
67
-
68
-
69
-
70
-
71
-
72
-
73
-
74
-
75
-
76
-
77
-
78
-
79
-
80
-
81
-
82
-
83
-
84
-
85
-
86
-
87
-
88
-
89
-
90
-
91
-
92
-
93
-
94
-
95
-
96
-
97
-
98
-
99
-
100
-
101
-
102
-
103
-
104
-
105
-
106
-
107
-
108
-
109
-
110
-
111
-
112
-
113
-
114
-
115
-
116
-
117
-
118
-
119
-
120
-
121
-
122
-
123
-
124
-
125
-
126
-
127
-
128
-
129
-
130
-
131
-
132
-
133
-
134
-
135
-
136
-
137
-
138
-
139
-
140
-
141
-
142
-
143
-
144
-
145
-
146
-
147
-
148
-
149
-
150
-
151
-
152
-
153
-
154
-
155
-
156
-
157
-
158
-
159
-
160
-
161
-
162
-
163
-
164
-
165
-
166
-
167
-
168
-
169
-
170
-
171
-
172
-
173
-
174
-
175
-
176
-
177
-
178
-
179
-
180
-
181
-
182
-
183
-
184
-
185
-
186
-
187
-
188
-
189
-
190
-
191
-
192
-
193
-
194
-
195
-
196
-
197
-
198
-
199
-
200
-
201
-
202
-
203
-
204
-
205
-
206
-
207
-
208
-
209
-
210
-
211
-
212
-
213
-
214
-
 215
215 -
 216
216 -
 217
217 -
 218
218 -
 219
219 -
 220
220 -
 221
221 -
 222
222 -
 223
223 -
 224
224 -
 225
225 -
 226
226 -
 227
227 -
 228
228 -
 229
229 -
 230
230 -
 231
231 -
 232
232 -
 233
233 -
 234
234 -
 235
235 -
236
-
237
-
238
-
239
-
240
-
241
-
242
-
243
-
244
-
245
-
246
-
247
-
248
-
249
-
250
-
251
-
252
-
253
-
254
-
255
-
256
-
257
-
258
-
259
-
260
-
261
-
262
-
263
-
264
-
265
-
266
-
267
-
268
-
269
-
270
-
271
-
272
-
273
-
274
-
275
-
276
-
277
-
278
-
279
-
280
-
281
-
282
-
283
-
284
-
285
 |
 |

228
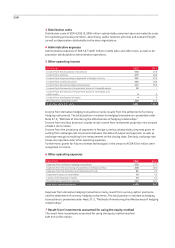
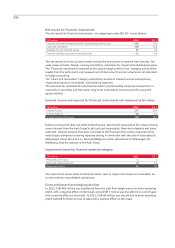
3 Distribution costs
Distribution costs of EUR 4,593 (3,599) million substantially comprise labor and materials costs
for marketing and sales promotion, advertising, public relations activities and outward freight,
as well as depreciation attributable to the sales organization.
4 Administrative expenses
Administrative expenses of EUR 527 (429) million include labor and other costs, as well as de-
preciation attributable to administrative operations.
5 Other operating income
EUR million 2012 2011
Income from the dissolution of provisions 544 278
Income from rebilling 475 368
Income from the processing of payments in foreign currency 251 233
Income from ancillary business 205 188
Income from derivative hedging transactions 127 369
Income from the reversal of impairment losses of intangible assets 20 –
Income from the reversal of impairment losses of receivables and
other assets 6 6
Income from the disposal of assets 4 9
Miscellaneous operating income 249 516
Total other operating income 1,881 1,967
Income from derivative hedging transactions mainly results from the settlement of currency
hedging instruments. The total position in relation to hedging transactions is presented under
Note 37.5, “Methods of monitoring the effectiveness of hedging relationships.”
Income from ancillary business includes rental income from investment property in the amount
of EUR 2 (0.2) million.
Income from the processing of payments in foreign currency substantially comprises gains re-
sulting from exchange-rate movements between the dates of output and payment, as well as
exchange-rate gains resulting from measurement on the closing date. Similarly, exchange rate
losses are reported under other operating expenses.
Furthermore, grants for future-oriented technologies in the amount of EUR 6 (4) million were
recognized in income.
6 Other operating expenses
EUR million 2012 2011
Expenses from derivative hedging transactions 630 277
Expenses from the processing of payments in foreign currency 218 162
Expenses from the allocation and recharging of costs 81 22
Impairment losses on receivables 14 19
Losses on the disposal of assets 10 10
Miscellaneous operating expenses 152 197
Total other operating expenses 1,106 687
Expenses from derivative hedging transactions mainly result from currency option premiums
and the settlement of currency hedging instruments. The total position in relation to hedging
transactions is presented under Note 37.5, “Methods of monitoring the effectiveness of hedging
relationships.”
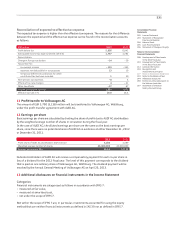
7 Result from investments accounted for using the equity method
The result from investments accounted for using the equity method reached
EUR 415 (270) million.