Audi 2012 Annual Report Download - page 282
Download and view the complete annual report
Please find page 282 of the 2012 Audi annual report below. You can navigate through the pages in the report by either clicking on the pages listed below, or by using the keyword search tool below to find specific information within the annual report.-
 1
1 -
2
-
3
-
4
-
5
-
6
-
7
-
8
-
9
-
10
-
11
-
12
-
13
-
14
-
15
-
16
-
17
-
18
-
19
-
20
-
21
-
22
-
23
-
24
-
25
-
26
-
27
-
28
-
29
-
30
-
31
-
32
-
33
-
34
-
35
-
36
-
37
-
38
-
39
-
40
-
41
-
42
-
43
-
44
-
45
-
46
-
47
-
48
-
49
-
50
-
51
-
52
-
53
-
54
-
55
-
56
-
57
-
58
-
59
-
60
-
61
-
62
-
63
-
64
-
65
-
66
-
67
-
68
-
69
-
70
-
71
-
72
-
73
-
74
-
75
-
76
-
77
-
78
-
79
-
80
-
81
-
82
-
83
-
84
-
85
-
86
-
87
-
88
-
89
-
90
-
91
-
92
-
93
-
94
-
95
-
96
-
97
-
98
-
99
-
100
-
101
-
102
-
103
-
104
-
105
-
106
-
107
-
108
-
109
-
110
-
111
-
112
-
113
-
114
-
115
-
116
-
117
-
118
-
119
-
120
-
121
-
122
-
123
-
124
-
125
-
126
-
127
-
128
-
129
-
130
-
131
-
132
-
133
-
134
-
135
-
136
-
137
-
138
-
139
-
140
-
141
-
142
-
143
-
144
-
145
-
146
-
147
-
148
-
149
-
150
-
151
-
152
-
153
-
154
-
155
-
156
-
157
-
158
-
159
-
160
-
161
-
162
-
163
-
164
-
165
-
166
-
167
-
168
-
169
-
170
-
171
-
172
-
173
-
174
-
175
-
176
-
177
-
178
-
179
-
180
-
181
-
182
-
183
-
184
-
185
-
186
-
187
-
188
-
189
-
190
-
191
-
192
-
193
-
194
-
195
-
196
-
197
-
198
-
199
-
200
-
201
-
202
-
203
-
204
-
205
-
206
-
207
-
208
-
209
-
210
-
211
-
212
-
213
-
214
-
215
-
216
-
217
-
218
-
219
-
220
-
221
-
222
-
223
-
224
-
225
-
226
-
227
-
228
-
229
-
230
-
231
-
232
-
233
-
234
-
235
-
236
-
237
-
238
-
239
-
240
-
241
-
242
-
243
-
244
-
245
-
246
-
247
-
248
-
249
-
250
-
251
-
252
-
253
-
254
-
255
-
256
-
257
-
258
-
259
-
260
-
261
-
262
-
263
-
264
-
265
-
266
-
267
-
268
-
269
-
270
-
271
-
 272
272 -
 273
273 -
 274
274 -
 275
275 -
 276
276 -
 277
277 -
 278
278 -
 279
279 -
 280
280 -
 281
281 -
 282
282 -
 283
283 -
 284
284 -
 285
285
 |
 |

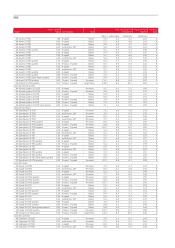
2003 1) 2004 1) 2005 1)
Production
Automotive segment Cars 2) 761,582 784,972 811,522
Engines 1,342,883 1,485,536 1,695,045
Motorcycles segment Motorcycles 3) – – –
Deliveries to customers
Automotive segment Cars 1,003,791 971,832 1,045,114
Audi brand Cars 769,893 779,441 829,109
Germany Cars 2 3 7,7 8 6 235,092 247,12 5
Outside Germany Cars 532,107 544,349 581,984
Lamborghini brand Cars 1,305 1,592 1,600
Other Volkswagen Group brands Cars 232,593 190,799 214,405
Motorcycles segment Motorcycles 3) – – –
Ducati brand Motorcycles 3) – – –
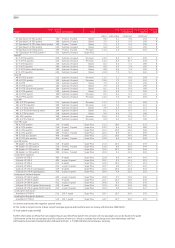
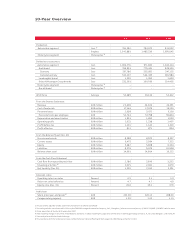
Workforce Average 52,689 53,144 52,412
From the Income Statement
Revenue EUR million 23,406 24,506 26,591
Cost of materials EUR million 17,16 3 17, 676 19,139
Personnel costs EUR million 2,938 3,072 3,136
Personnel costs per employee EUR 55,763 5 7,7 9 8 59,834
Depreciation and amortization EUR million 1,833 1,852 1,930
Operating profit EUR million 1,051 1,238 1,407
Profit before tax EUR million 1,101 1,143 1,310
Profit after tax EUR million 811 871 824
From the Balance Sheet (Dec. 31)
Non-current assets EUR million 8,588 8,970 8,597
Current assets EUR million 5,475 5,934 7, 51 5
Equity EUR million 5,487 5,828 6,104
Liabilities EUR million 8,576 9,076 10,008
Balance sheet total EUR million 14,063 14,904 16,112
From the Cash Flow Statement
Cash flow from operating activities EUR million 2,786 2,690 3,252
Investing activities 4) EUR million 2,015 2,041 1,670
Net liquidity (Dec. 31) EUR million 1,530 2,033 3,391
Financial ratios
Operating return on sales Percent 4.5 5.1 5.3
Return on sales before tax Percent 4.7 4.7 4.9
Equity ratio (Dec. 31) Percent 39.0 39.1 37.9
Audi share
Share price (year-end price) 5) EUR 225.00 220.15 308.00
Compensatory payment EUR 1.05 1.05 1.15
1) Financial data adjusted to take account of amendments to IAS 19 and IAS 38
2) Including vehicles manufactured in China by the FAW-Volkswagen Automotive Company, Ltd., Changchun, joint venture since January 1, 2012. 333,465 (216,053) vehicles were m
3) Since acquisition of the Ducati Group in July 2012
4) Not including changes in securities, fixed deposits and loans; in 2012 including the acquisition of interests in Volkswagen Group Services S.A., Brussels (Belgium), and in DUCATI M
5) Year-end price on Munich Stock Exchange
6) In accordance with the resolution to be passed by the Annual General Meeting of Volkswagen AG, Wolfsburg, on April 25, 2013
10-Year Overview