Audi 2012 Annual Report Download - page 231
Download and view the complete annual report
Please find page 231 of the 2012 Audi annual report below. You can navigate through the pages in the report by either clicking on the pages listed below, or by using the keyword search tool below to find specific information within the annual report.-
 1
1 -
2
-
3
-
4
-
5
-
6
-
7
-
8
-
9
-
10
-
11
-
12
-
13
-
14
-
15
-
16
-
17
-
18
-
19
-
20
-
21
-
22
-
23
-
24
-
25
-
26
-
27
-
28
-
29
-
30
-
31
-
32
-
33
-
34
-
35
-
36
-
37
-
38
-
39
-
40
-
41
-
42
-
43
-
44
-
45
-
46
-
47
-
48
-
49
-
50
-
51
-
52
-
53
-
54
-
55
-
56
-
57
-
58
-
59
-
60
-
61
-
62
-
63
-
64
-
65
-
66
-
67
-
68
-
69
-
70
-
71
-
72
-
73
-
74
-
75
-
76
-
77
-
78
-
79
-
80
-
81
-
82
-
83
-
84
-
85
-
86
-
87
-
88
-
89
-
90
-
91
-
92
-
93
-
94
-
95
-
96
-
97
-
98
-
99
-
100
-
101
-
102
-
103
-
104
-
105
-
106
-
107
-
108
-
109
-
110
-
111
-
112
-
113
-
114
-
115
-
116
-
117
-
118
-
119
-
120
-
121
-
122
-
123
-
124
-
125
-
126
-
127
-
128
-
129
-
130
-
131
-
132
-
133
-
134
-
135
-
136
-
137
-
138
-
139
-
140
-
141
-
142
-
143
-
144
-
145
-
146
-
147
-
148
-
149
-
150
-
151
-
152
-
153
-
154
-
155
-
156
-
157
-
158
-
159
-
160
-
161
-
162
-
163
-
164
-
165
-
166
-
167
-
168
-
169
-
170
-
171
-
172
-
173
-
174
-
175
-
176
-
177
-
178
-
179
-
180
-
181
-
182
-
183
-
184
-
185
-
186
-
187
-
188
-
189
-
190
-
191
-
192
-
193
-
194
-
195
-
196
-
197
-
198
-
199
-
200
-
201
-
202
-
203
-
204
-
205
-
206
-
207
-
208
-
209
-
210
-
211
-
212
-
213
-
214
-
215
-
216
-
217
-
218
-
219
-
220
-
 221
221 -
 222
222 -
 223
223 -
 224
224 -
 225
225 -
 226
226 -
 227
227 -
 228
228 -
 229
229 -
 230
230 -
 231
231 -
 232
232 -
 233
233 -
 234
234 -
 235
235 -
 236
236 -
 237
237 -
 238
238 -
 239
239 -
 240
240 -
 241
241 -
242
-
243
-
244
-
245
-
246
-
247
-
248
-
249
-
250
-
251
-
252
-
253
-
254
-
255
-
256
-
257
-
258
-
259
-
260
-
261
-
262
-
263
-
264
-
265
-
266
-
267
-
268
-
269
-
270
-
271
-
272
-
273
-
274
-
275
-
276
-
277
-
278
-
279
-
280
-
281
-
282
-
283
-
284
-
285
 |
 |

234
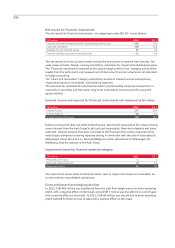
16 Leasing and rental assets and investment property
EUR million Dec. 31, 2012 Dec. 31, 2011
Leasing and rental assets 2 5
Investment property 118 3
The carrying amounts of the leased assets and investment property correspond to the fair values.
The fair values were calculated internally on the basis of recognized measurement methods.
With regard to the investment property, the amount of EUR 115 million relates to buildings and
land leased on the basis of a financial lease arrangement. The maximum interest rate on which
the lease is based is 4.4 percent. The financial lease payments due in future, together with their
present values, are listed in the following table:
EUR million 2013 2014 to 2017 from 2018 Total
Lease payments 834 146 188
Interest elements 0 3 68 72
Present value 831 77 116
No operating costs were incurred in relation to maintaining the investment property.
The following payments are expected in future from non-cancelable operating leases related to
this investment property:
EUR million 2013 2014 to 2017 from 2018 Total
Lease payments 415 56 75
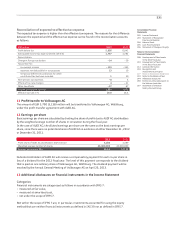
17 Investments accounted for using the equity method
Changes in relation to the investments accounted for using the equity method in FAW-
Volkswagen Automotive Company Ltd., Changchun (China) and Volkswagen Group Services S.A.,
Brussels (Belgium), are shown in the development of the fixed assets. The acquisition of the
holding in Volkswagen Group Services S.A. resulted in the addition of EUR 3,000 million during
the 2012 fiscal year.
On the basis of the interest held, the following values are attributable to the Audi Group from its
investments accounted for using the equity method:
EUR million 2012 2011
Non-current assets 2,535 398
Current assets 4,176 820
Non-current liabilities 261 79
Current liabilities 2,811 679
Revenues 3,261 2,378
Profit 415 270
18 Other long-term investments
EUR million Dec. 31, 2012 Dec. 31, 2011
Investments in affiliated companies 128 143
Shares in associated companies and participating interests 126 100
Total 254 244