Audi 2012 Annual Report Download - page 242
Download and view the complete annual report
Please find page 242 of the 2012 Audi annual report below. You can navigate through the pages in the report by either clicking on the pages listed below, or by using the keyword search tool below to find specific information within the annual report.-
 1
1 -
2
-
3
-
4
-
5
-
6
-
7
-
8
-
9
-
10
-
11
-
12
-
13
-
14
-
15
-
16
-
17
-
18
-
19
-
20
-
21
-
22
-
23
-
24
-
25
-
26
-
27
-
28
-
29
-
30
-
31
-
32
-
33
-
34
-
35
-
36
-
37
-
38
-
39
-
40
-
41
-
42
-
43
-
44
-
45
-
46
-
47
-
48
-
49
-
50
-
51
-
52
-
53
-
54
-
55
-
56
-
57
-
58
-
59
-
60
-
61
-
62
-
63
-
64
-
65
-
66
-
67
-
68
-
69
-
70
-
71
-
72
-
73
-
74
-
75
-
76
-
77
-
78
-
79
-
80
-
81
-
82
-
83
-
84
-
85
-
86
-
87
-
88
-
89
-
90
-
91
-
92
-
93
-
94
-
95
-
96
-
97
-
98
-
99
-
100
-
101
-
102
-
103
-
104
-
105
-
106
-
107
-
108
-
109
-
110
-
111
-
112
-
113
-
114
-
115
-
116
-
117
-
118
-
119
-
120
-
121
-
122
-
123
-
124
-
125
-
126
-
127
-
128
-
129
-
130
-
131
-
132
-
133
-
134
-
135
-
136
-
137
-
138
-
139
-
140
-
141
-
142
-
143
-
144
-
145
-
146
-
147
-
148
-
149
-
150
-
151
-
152
-
153
-
154
-
155
-
156
-
157
-
158
-
159
-
160
-
161
-
162
-
163
-
164
-
165
-
166
-
167
-
168
-
169
-
170
-
171
-
172
-
173
-
174
-
175
-
176
-
177
-
178
-
179
-
180
-
181
-
182
-
183
-
184
-
185
-
186
-
187
-
188
-
189
-
190
-
191
-
192
-
193
-
194
-
195
-
196
-
197
-
198
-
199
-
200
-
201
-
202
-
203
-
204
-
205
-
206
-
207
-
208
-
209
-
210
-
211
-
212
-
213
-
214
-
215
-
216
-
217
-
218
-
219
-
220
-
221
-
222
-
223
-
224
-
225
-
226
-
227
-
228
-
229
-
230
-
231
-
 232
232 -
 233
233 -
 234
234 -
 235
235 -
 236
236 -
 237
237 -
 238
238 -
 239
239 -
 240
240 -
 241
241 -
 242
242 -
 243
243 -
 244
244 -
 245
245 -
 246
246 -
 247
247 -
 248
248 -
 249
249 -
 250
250 -
 251
251 -
 252
252 -
253
-
254
-
255
-
256
-
257
-
258
-
259
-
260
-
261
-
262
-
263
-
264
-
265
-
266
-
267
-
268
-
269
-
270
-
271
-
272
-
273
-
274
-
275
-
276
-
277
-
278
-
279
-
280
-
281
-
282
-
283
-
284
-
285
 |
 |

245
Consolidated Financial
Statements
202 Income Statement
203 Statement of Recognized
Income and Expense
204 Balance Sheet
205 Cash Flow Statement
206 Statement of Changes in Equity
Notes to the Consolidated
Financial Statements
208 Development of fixed assets
in the 2012 fiscal year
210 Development of fixed assets
in the 2011 fiscal year
212 General information
218 Recognition and
measurement principles
227 Notes to the Income Statement
233 Notes to the Balance Sheet
244 Additional disclosures
266 Events occurring subsequent to
the balance sheet date
267 Statement of Interests
held by the Audi Group
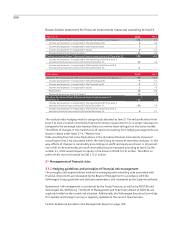
36 Additional disclosures on financial instruments in the Balance Sheet
Measurement of financial instruments at fair value is based on a three-level hierarchy and on the
proximity of the measurement factors used to an active market. An active market is one in which
homogeneous products are traded, where willing buyers and sellers can be found for them at all
times, and where their prices are publicly available. Level 1 involves the measurement of financial
instruments, such as securities, listed on active markets.
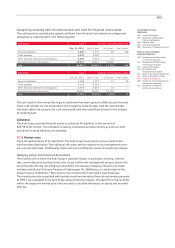
Level 2 involves the measurement of financial instruments such as derivatives based on market-
related, recognized financial valuation models, where the measurement factors, such as exchange
rates or interest rates, can be observed directly or indirectly on active markets.
In the Audi Group, level 3 mainly covers residual value hedging arrangements with the retail trade.
The input factors for measuring the future development of used car prices cannot be observed
on active markets; they are forecast by various independent institutions. The residual value
hedging model is explained in Note 37.4, “Market risks.”
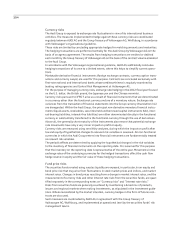
Furthermore, non-current commodity futures are also measured according to level 3, as the key
parameters for their measurement cannot be observed on active markets owing to the long-term
nature of the contracts, but are extrapolated. During the previous year, rights to acquire shares
in companies were also assigned to fair value level 3, at which input factors that are not derived
from active markets can be used for measurement.