Singapore Airlines 2008 Annual Report Download - page 88
Download and view the complete annual report
Please find page 88 of the 2008 Singapore Airlines annual report below. You can navigate through the pages in the report by either clicking on the pages listed below, or by using the keyword search tool below to find specific information within the annual report.-
 1
1 -
2
-
3
-
4
-
5
-
6
-
7
-
8
-
9
-
10
-
11
-
12
-
13
-
14
-
15
-
16
-
17
-
18
-
19
-
20
-
21
-
22
-
23
-
24
-
25
-
26
-
27
-
28
-
29
-
30
-
31
-
32
-
33
-
34
-
35
-
36
-
37
-
38
-
39
-
40
-
41
-
42
-
43
-
44
-
45
-
46
-
47
-
48
-
49
-
50
-
51
-
52
-
53
-
54
-
55
-
56
-
57
-
58
-
59
-
60
-
61
-
62
-
63
-
64
-
65
-
66
-
67
-
68
-
69
-
70
-
71
-
72
-
73
-
74
-
75
-
76
-
77
-
 78
78 -
 79
79 -
 80
80 -
 81
81 -
 82
82 -
 83
83 -
 84
84 -
 85
85 -
 86
86 -
 87
87 -
 88
88 -
 89
89 -
 90
90 -
 91
91 -
 92
92 -
 93
93 -
 94
94 -
 95
95 -
 96
96 -
 97
97 -
 98
98 -
99
-
100
-
101
-
102
-
103
-
104
-
105
-
106
-
107
-
108
-
109
-
110
-
111
-
112
-
113
-
114
-
115
-
116
-
117
-
118
-
119
-
120
-
121
-
122
-
123
-
124
-
125
-
126
-
127
-
128
-
129
-
130
-
131
-
132
-
133
-
134
-
135
-
136
-
137
-
138
-
139
-
140
-
141
-
142
-
143
-
144
-
145
-
146
-
147
-
148
-
149
-
150
-
151
-
152
-
153
-
154
-
155
-
156
-
157
-
158
-
159
-
160
-
161
-
162
-
163
-
164
-
165
-
166
-
167
-
168
-
169
-
170
-
171
-
172
-
173
-
174
-
175
-
176
-
177
-
178
 |
 |

Singapore Airlines Annual Report 2007-08
86
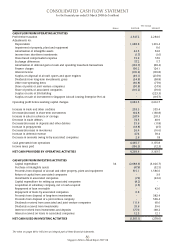
The Group
Notes 2007-08 2006-07
CASH FLOW FROM OPERATING ACTIVITIES
Profit before taxation 2,547.2 2,284.6
Adjustments for:
Depreciation 1,488.8 1,319.4
Impairment of property, plant and equipment - 0.6
Amortisation of intangible assets 42.5 54.0
Income from short-term investments (1.7) (1.6)
Share-based compensation expense 73.9 57.6
Exchange differences 57.2 5.7
Amortisation of deferred gain on sale and operating leaseback transactions (102.7) (88.4)
Finance charges 100.2 124.1
Interest income (181.2) (181.8)
Surplus on disposal of aircraft, spares and spare engines (49.1) (237.9)
Dividends from long-term investments, gross (34.8) (38.8)
Other non-operating items (96.8) (77.9)
Share of profits of joint venture companies (50.8) (57.9)
Share of profits of associated companies (110.2) (79.0)
Surplus on sale of SIA Building - (223.3)
Surplus on sale of investment in Singapore Aircraft Leasing Enterprise Pte Ltd - (197.7)
Operating profit before working capital changes 3,682.5 2,661.7
Increase in trade and other creditors 203.3 355.4
Decrease/(Increase) in short-term investments 104.8 (130.8)
Increase in sales in advance of carriage 287.4 201.3
Decrease in trade debtors 74.5 40.9
Decrease/(Increase) in deposits and other debtors 55.6 (11.8)
Increase in prepayments (18.8) (4.5)
Decrease/(Increase) in inventories 26.4 (16.6)
Increase in deferred revenue 47.4 78.4
Decrease in amounts owing to/by associated companies 2.6 1.8
Cash generated from operations 4,465.7 3,175.8
Income taxes paid (196.3) (12.3)
NET CASH PROVIDED BY OPERATING ACTIVITIES 4,269.4 3,163.5
CASH FLOW FROM INVESTING ACTIVITIES
Capital expenditure 34 (2,088.6) (3,026.7)
Purchase of intangible assets (47.6) (32.5)
Proceeds from disposal of aircraft and other property, plant and equipment 515.1 1,586.6
Return of capital from associated companies - 3.9
Investments in associated companies (7.6) (23.6)
Capital expenditure for setting up associated companies (8.2) -
Acquisition of subsidiary company, net of cash acquired (1.5) -
Repayment of loan receivable - 42.0
Repayment of loans by associated companies 0.8 -
Proceeds from disposal of long-term investments - 382.4
Proceeds from disposal of a joint venture company - 509.4
Dividends received from associated and joint venture companies 111.4 60.6
Dividends received from investments 35.6 39.6
Interest received from investments and deposits 177.0 168.2
Interest received on loans to associated companies 12.5 12.1
NET CASH USED IN INVESTING ACTIVITIES (1,301.1) (278.0)
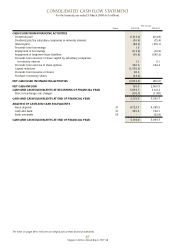
CONSOLIDATED CASH FLOW STATEMENT
For the financial year ended 31 March 2008 (in $ million)
The notes on pages 88 to 160 form an integral part of these financial statements.