Singapore Airlines 2008 Annual Report Download - page 57
Download and view the complete annual report
Please find page 57 of the 2008 Singapore Airlines annual report below. You can navigate through the pages in the report by either clicking on the pages listed below, or by using the keyword search tool below to find specific information within the annual report.-
 1
1 -
2
-
3
-
4
-
5
-
6
-
7
-
8
-
9
-
10
-
11
-
12
-
13
-
14
-
15
-
16
-
17
-
18
-
19
-
20
-
21
-
22
-
23
-
24
-
25
-
26
-
27
-
28
-
29
-
30
-
31
-
32
-
33
-
34
-
35
-
36
-
37
-
38
-
39
-
40
-
41
-
42
-
43
-
44
-
45
-
46
-
 47
47 -
 48
48 -
 49
49 -
 50
50 -
 51
51 -
 52
52 -
 53
53 -
 54
54 -
 55
55 -
 56
56 -
 57
57 -
 58
58 -
 59
59 -
 60
60 -
 61
61 -
 62
62 -
 63
63 -
 64
64 -
 65
65 -
 66
66 -
 67
67 -
68
-
69
-
70
-
71
-
72
-
73
-
74
-
75
-
76
-
77
-
78
-
79
-
80
-
81
-
82
-
83
-
84
-
85
-
86
-
87
-
88
-
89
-
90
-
91
-
92
-
93
-
94
-
95
-
96
-
97
-
98
-
99
-
100
-
101
-
102
-
103
-
104
-
105
-
106
-
107
-
108
-
109
-
110
-
111
-
112
-
113
-
114
-
115
-
116
-
117
-
118
-
119
-
120
-
121
-
122
-
123
-
124
-
125
-
126
-
127
-
128
-
129
-
130
-
131
-
132
-
133
-
134
-
135
-
136
-
137
-
138
-
139
-
140
-
141
-
142
-
143
-
144
-
145
-
146
-
147
-
148
-
149
-
150
-
151
-
152
-
153
-
154
-
155
-
156
-
157
-
158
-
159
-
160
-
161
-
162
-
163
-
164
-
165
-
166
-
167
-
168
-
169
-
170
-
171
-
172
-
173
-
174
-
175
-
176
-
177
-
178
 |
 |
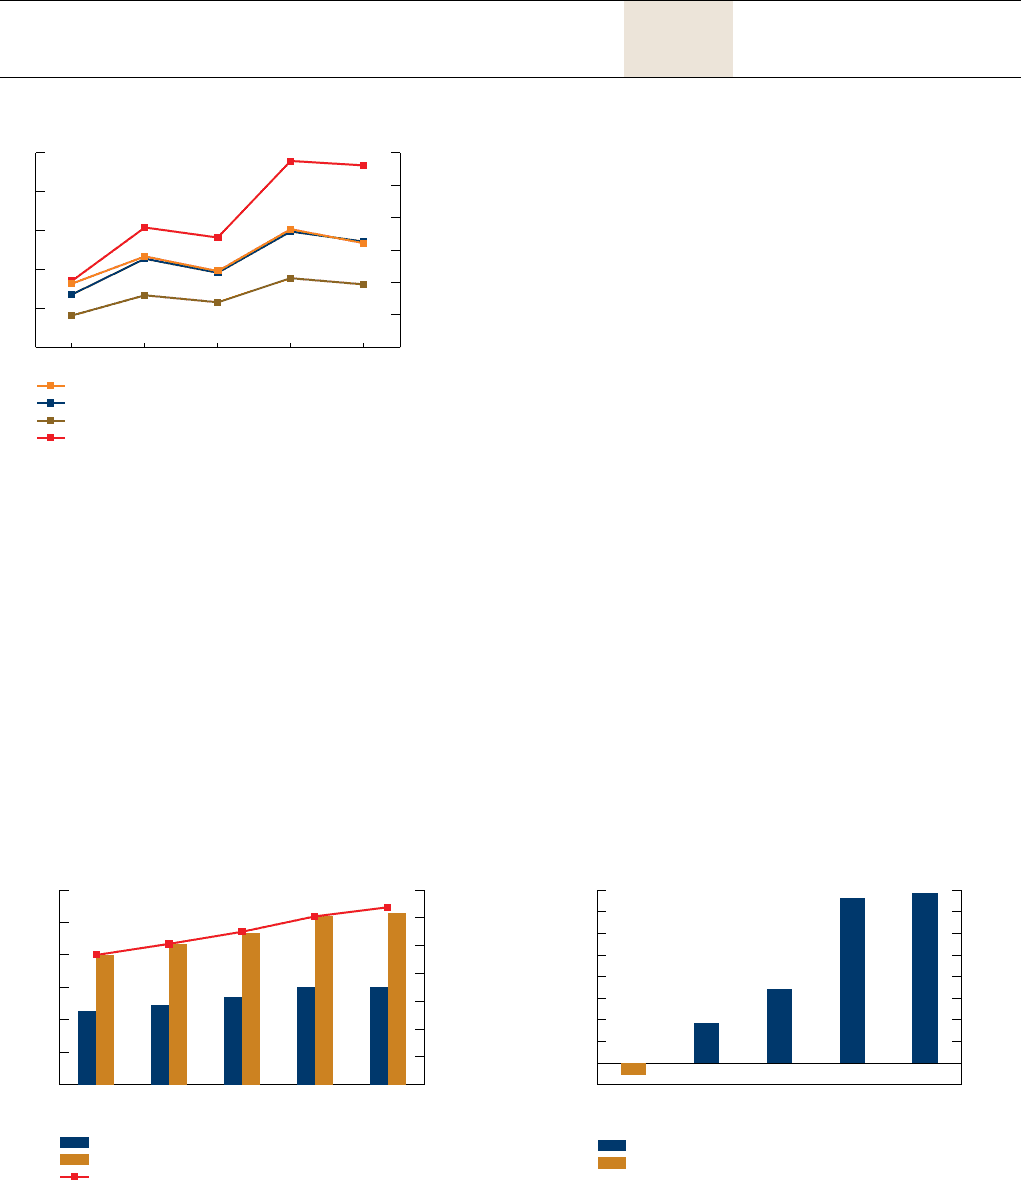
PerCent
Cents
ReturnonTurnover(%)
ReturnonAverageEquityHolders'Funds(%)
ReturnonAverageTo talAssets(%)
BasicEarningsPerShare(¢)
0
5
10
15
20
25
0
30
60
90
120
150
180
2007-082006-072005-062004-052003-04
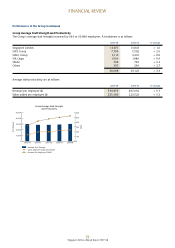
Group Profitability Ratios
$Million
Dollars
EquityHolders'Funds($Million)
TotalAssets($Million)
NAVPerShare($)
0
5,000
10,000
15,000
20,000
25,000
30,000
0
2
4
6
8
10
12
14
20082007200620052004
Group Equity Holders’ Funds, To tal Assets
and Net Asset Value (NAV) Per Share
31March
$Million
$Million
NetLiquidAssets
NetDebt
-500
0
500
1,000
1,500
2,000
2,500
3,000
3,500
4,000
-500
0
500
1,000
1,500
2,000
2,500
3,000
3,500
4,000
20082007200620052004
Group Net Liquid Assets and Net Debt
31March
Singapore Airlines Annual Report 2007-08
55
FINANCIAL REVIEW
Performance of the Group (continued)
Group Earnings (continued)
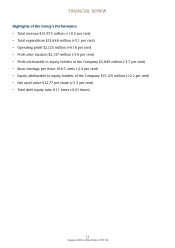
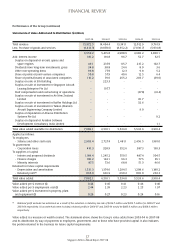
ProtabilityratiosoftheGroupareasfollows:
2007-08 2006-07 Change
% % % points
Returnonturnover 13.4 15.2 – 1.8
Returnonaveragetotalassets 8.1 8.9 – 0.8
Returnonaverageequityholders’funds 13.6 14.9 – 1.3
Financial Position of the Group
TheGroup’stotalassetsstoodat$26,515millionasat31March2008,up2.0percentfromayearago.Netassetvalueper
shareimproved5.5percentto$12.77.
Equityholders’fundsincreased0.2percentto$15,125millionasat31March2008,mainlyattributabletoprotforthe
nancialyear,partiallyoffsetbypaymentofdividendsandcapitalreductionduringthenancialyear.Dividendspaidincluded
specialdividendof50centspershareandnaldividendof35centspershareinrespectofnancialyear2006-07andinterim
dividendof20centspershareinrespectofnancialyear2007-08.Pursuanttoacapitalreductionexercise84,309,846shares
werecancelledatthepriceof$18.46pershare,while1,093,530shareswereissuedunderatop-upofferofnewsharesatthe
priceof$18.46persharetoenableshareholderstorounduptheirholdingofsharesafterthecapitalreductiontothenearest
multipleof200shares.
TheGroupimproveditsnetliquidassetsR1positionfrom$3,810millionayearagoto$3,927millionasat31March2008.This
strongerliquidityposition(+$117million)wasaresultofstrongercashgeneratedfromoperations.Totaldebttoequityratio
improvedmarginallyby0.01timesto0.11times.
R1 Net liquid assets is defined as the sum of cash and bank balances (net of bank overdrafts), investments, loans to third parties, and net of
finance lease commitments, loans and fixed rate notes issued.