Singapore Airlines 2008 Annual Report Download - page 5
Download and view the complete annual report
Please find page 5 of the 2008 Singapore Airlines annual report below. You can navigate through the pages in the report by either clicking on the pages listed below, or by using the keyword search tool below to find specific information within the annual report.-
 1
1 -
 2
2 -
 3
3 -
 4
4 -
 5
5 -
 6
6 -
 7
7 -
 8
8 -
 9
9 -
 10
10 -
 11
11 -
 12
12 -
 13
13 -
 14
14 -
 15
15 -
 16
16 -
17
-
18
-
19
-
20
-
21
-
22
-
23
-
24
-
25
-
26
-
27
-
28
-
29
-
30
-
31
-
32
-
33
-
34
-
35
-
36
-
37
-
38
-
39
-
40
-
41
-
42
-
43
-
44
-
45
-
46
-
47
-
48
-
49
-
50
-
51
-
52
-
53
-
54
-
55
-
56
-
57
-
58
-
59
-
60
-
61
-
62
-
63
-
64
-
65
-
66
-
67
-
68
-
69
-
70
-
71
-
72
-
73
-
74
-
75
-
76
-
77
-
78
-
79
-
80
-
81
-
82
-
83
-
84
-
85
-
86
-
87
-
88
-
89
-
90
-
91
-
92
-
93
-
94
-
95
-
96
-
97
-
98
-
99
-
100
-
101
-
102
-
103
-
104
-
105
-
106
-
107
-
108
-
109
-
110
-
111
-
112
-
113
-
114
-
115
-
116
-
117
-
118
-
119
-
120
-
121
-
122
-
123
-
124
-
125
-
126
-
127
-
128
-
129
-
130
-
131
-
132
-
133
-
134
-
135
-
136
-
137
-
138
-
139
-
140
-
141
-
142
-
143
-
144
-
145
-
146
-
147
-
148
-
149
-
150
-
151
-
152
-
153
-
154
-
155
-
156
-
157
-
158
-
159
-
160
-
161
-
162
-
163
-
164
-
165
-
166
-
167
-
168
-
169
-
170
-
171
-
172
-
173
-
174
-
175
-
176
-
177
-
178
 |
 |
Singapore Airlines Annual Report 2007-08
3
OPERATING STATISTICS
2006-07 2005-06 % Change
–––––––––––––––––––––––––––––––––––––––––––––––––––––––––––––––––––––––––––––––––––––––––––––––––––––––––––––––––––––––––––––––––––––––––––––––––––––––––––––––––––––––––––––––––––
Singapore Airlines
Passengers carried (thousand) 18,346 16,995 + 7.9
Revenue passenger-km (million) 89,148.8 82,741.7 + 7.7
Available seat-km (million) 112,543.8 109,483.7 + 2.8
Passenger load factor (%) 79.2 75.6 + 3.6 points
Passenger yield (cents/pkm) 10.9 10.6 + 2.8
Passenger unit cost (cents/ask) 7.9 7.5 + 5.3
Passenger breakeven load factor (%) 72.5 70.8 + 1.7 points
SIA Cargo
Cargo and mail carried (million kg) 1,284.9 1,248.5 + 2.9
Cargo load (million tonne-km) 7,995.6 7,874.4 + 1.5
Gross capacity (million tonne-km) 12,889.8 12,378.9 + 4.1
Cargo load factor (%) 62.0 63.6 – 1.6 points
Cargo yield (cents/ltk) 38.4 38.6 – 0.5
Cargo unit cost (cents/ctk) 24.5 23.5 + 4.3
Cargo breakeven load factor (%) 63.8 60.9 + 2.9 points
Singapore Airlines and SIA Cargo
Overall load (million tonne-km) 16,486.8 15,806.8 + 4.3
Overall capacity (million tonne-km) 24,009.7 23,208.0 + 3.5
Overall load factor (%) 68.7 68.1 + 0.6 point
Overall yield (cents/ltk) 77.5 74.6 + 3.9
Overall unit cost (cents/ctk) 50.0 47.7 + 4.8
Overall breakeven load factor (%) 64.5 63.9 + 0.6 point
Employee Productivity (Average) – Company
Average number of employees 13,847 13,729 + 0.9
Seat capacity per employee (seat-km) 8,127,667 7,974,630 + 1.9
Passenger load per employee (tonne-km) R1 613,211 577,784 + 6.1
Revenue per employee ($) 819,232 750,441 + 9.2
Value added per employee ($) 368,831 258,810 + 42.5
Employee Productivity (Average) – Group
Average number of employees 29,125 28,558 + 2.0
Revenue per employee ($) 497,662 467,158 + 6.5
Value added per employee ($) 223,523 193,781 + 15.3
R1 Passenger load includes excess baggage carried.
GLOSSARY
Singapore Airlines
Revenue passenger-km = Number of passengers carried x distance flown (in km)
Available seat-km = Number of available seats x distance flown (in km)
Passenger load factor = Revenue passenger-km expressed as a percentage of available seat-km
Passenger yield = Passenger revenue from scheduled services divided by revenue passenger-km
Passenger unit cost = Operating expenditure (less bellyhold revenue from SIA Cargo) divided by available seat-km
Passenger breakeven load factor = Passenger unit cost expressed as a percentage of passenger yield. This is the theoretical load factor
at which passenger revenue equates to the operating expenditure (less bellyhold revenue from SIA Cargo)
SIA Cargo
Cargo load = Cargo and mail load carried (in tonnes) x distance flown (in km)
Gross capacity = Cargo capacity production (in tonnes) x distance flown (in km)
Cargo load factor = Cargo and mail load (in tonne-km) expressed as a percentage of gross capacity (in tonne-km)
Cargo yield = Cargo and mail revenue from scheduled services divided by cargo load (in tonne-km)
Cargo unit cost = Operating expenditure (including bellyhold expenditure to Singapore Airlines) divided by gross capacity
(in tonne-km)
Cargo breakeven load factor = Cargo unit cost expressed as a percentage of cargo yield. This is the theoretical load factor at which
cargo revenue equates to the operating expenditure (including bellyhold expenditure to Singapore Airlines)
Singapore Airlines and SIA Cargo
Overall load = Total load carried (in tonnes) x distance flown (in km)
Overall capacity = Total capacity production (in tonnes) x distance flown (in km)
Overall load factor = Overall load (in tonne-km) expressed as a percentage of overall capacity (in tonne-km)
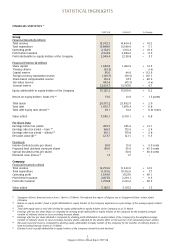
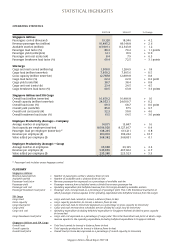
OPERATING STATISTICS
2007-08 2006-07 % Change
Singapore Airlines
Passengers carried (thousand) 19,120 18,346 + 4.2
Revenue passenger-km (million) 91,485.2 89,148.8 + 2.6
Available seat-km (million) 113,919.1 112,543.8 + 1.2
Passenger load factor (%) 80.3 79.2 + 1.1 points
Passenger yield (cents/pkm) 12.1 10.9 + 11.0
Passenger unit cost (cents/ask) 8.4 7.9 + 6.3
Passenger breakeven load factor (%) 69.4 72.5 – 3.1 points
SIA Cargo
Cargo and mail carried (million kg) 1,308.0 1,284.9 + 1.8
Cargo load (million tonne-km) 7,959.2 7,995.6 – 0.5
Gross capacity (million tonne-km) 12,787.8 12,889.8 – 0.8
Cargo load factor (%) 62.2 62.0 + 0.2 point
Cargo yield (cents/ltk) 38.7 38.4 + 0.8
Cargo unit cost (cents/ctk) 23.4 24.5 – 4.5
Cargo breakeven load factor (%) 60.5 63.8 – 3.3 points
Singapore Airlines and SIA Cargo
Overall load (million tonne-km) 16,659.2 16,486.8 + 1.0
Overall capacity (million tonne-km) 24,052.1 24,009.7 + 0.2
Overall load factor (%) 69.3 68.7 + 0.6 point
Overall yield (cents/ltk) 85.0 77.5 + 9.7
Overall unit cost (cents/ctk) 52.3 50.0 + 4.6
Overall breakeven load factor (%) 61.5 64.5 – 3.0 points
Employee Productivity (Average) – Company
Average number of employees 14,071 13,847 + 1.6
Seat capacity per employee (seat-km) 8,096,020 8,127,667 – 0.4
Passenger load per employee (tonne-km) R1 618,295 613,211 + 0.8
Revenue per employee ($) 906,801 819,232 + 10.7
Value added per employee ($) 368,382 368,831 – 0.1
Employee Productivity (Average) – Group
Average number of employees 30,088 29,125 + 3.3
Revenue per employee ($) 530,859 497,662 + 6.7
Value added per employee ($) 235,380 223,523 + 5.3
R1 Passenger load includes excess baggage carried.
GLOSSARY
Singapore Airlines
Revenue passenger-km = Number of passengers carried x distance flown (in km)
Available seat-km = Number of available seats x distance flown (in km)
Passenger load factor = Revenue passenger-km expressed as a percentage of available seat-km
Passenger yield = Passenger revenue from scheduled services divided by revenue passenger-km
Passenger unit cost = Operating expenditure (less bellyhold revenue from SIA Cargo) divided by available seat-km
Passenger breakeven load factor = Passenger unit cost expressed as a percentage of passenger yield. This is the theoretical load factor at
which passenger revenue equates to the operating expenditure (less bellyhold revenue from SIA Cargo)
SIA Cargo
Cargo load = Cargo and mail load carried (in tonnes) x distance flown (in km)
Gross capacity = Cargo capacity production (in tonnes) x distance flown (in km)
Cargo load factor = Cargo and mail load (in tonne-km) expressed as a percentage of gross capacity (in tonne-km)
Cargo yield = Cargo and mail revenue from scheduled services divided by cargo load (in tonne-km)
Cargo unit cost = Operating expenditure (including bellyhold expenditure to Singapore Airlines) divided by gross capacity
(in tonne-km)
Cargo breakeven load factor = Cargo unit cost expressed as a percentage of cargo yield. This is the theoretical load factor at which cargo
revenue equates to the operating expenditure (including bellyhold expenditure to Singapore Airlines)
Singapore Airlines and SIA Cargo
Overall load = Total load carried (in tonnes) x distance flown (in km)
Overall capacity = Total capacity production (in tonnes) x distance flown (in km)
Overall load factor = Overall load (in tonne-km) expressed as a percentage of overall capacity (in tonne-km)
STATISTICAL HIGHLIGHTS