Singapore Airlines 2008 Annual Report Download - page 59
Download and view the complete annual report
Please find page 59 of the 2008 Singapore Airlines annual report below. You can navigate through the pages in the report by either clicking on the pages listed below, or by using the keyword search tool below to find specific information within the annual report.-
 1
1 -
2
-
3
-
4
-
5
-
6
-
7
-
8
-
9
-
10
-
11
-
12
-
13
-
14
-
15
-
16
-
17
-
18
-
19
-
20
-
21
-
22
-
23
-
24
-
25
-
26
-
27
-
28
-
29
-
30
-
31
-
32
-
33
-
34
-
35
-
36
-
37
-
38
-
39
-
40
-
41
-
42
-
43
-
44
-
45
-
46
-
47
-
48
-
 49
49 -
 50
50 -
 51
51 -
 52
52 -
 53
53 -
 54
54 -
 55
55 -
 56
56 -
 57
57 -
 58
58 -
 59
59 -
 60
60 -
 61
61 -
 62
62 -
 63
63 -
 64
64 -
 65
65 -
 66
66 -
 67
67 -
 68
68 -
 69
69 -
70
-
71
-
72
-
73
-
74
-
75
-
76
-
77
-
78
-
79
-
80
-
81
-
82
-
83
-
84
-
85
-
86
-
87
-
88
-
89
-
90
-
91
-
92
-
93
-
94
-
95
-
96
-
97
-
98
-
99
-
100
-
101
-
102
-
103
-
104
-
105
-
106
-
107
-
108
-
109
-
110
-
111
-
112
-
113
-
114
-
115
-
116
-
117
-
118
-
119
-
120
-
121
-
122
-
123
-
124
-
125
-
126
-
127
-
128
-
129
-
130
-
131
-
132
-
133
-
134
-
135
-
136
-
137
-
138
-
139
-
140
-
141
-
142
-
143
-
144
-
145
-
146
-
147
-
148
-
149
-
150
-
151
-
152
-
153
-
154
-
155
-
156
-
157
-
158
-
159
-
160
-
161
-
162
-
163
-
164
-
165
-
166
-
167
-
168
-
169
-
170
-
171
-
172
-
173
-
174
-
175
-
176
-
177
-
178
 |
 |

Singapore Airlines Annual Report 2007-08
57
FINANCIAL REVIEW
Performance of the Group (continued)
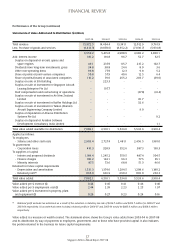
Statements of Value Added and its Distribution ($ million)
2007-08 2006-07 2005-06 2004-05 2003-04
Totalrevenue 15,972.5 14,494.4 13,341.1 12,012.9 9,761.9
Less:Purchaseofgoodsandservices (9,413.3) (9,078.6) (8,352.2) (7,030.7) (5,931.8)
6,559.2 5,415.8 4,988.9 4,982.2 3,830.1
Add:Interestincome 181.2 181.8 96.7 52.7 32.5
Surplusondisposalofaircraft,sparesand
spareengines 49.1 237.9 115.7 215.2 102.7
Dividendsfromlong-terminvestments,gross 34.8 38.8 24.6 8.0 3.6
Othernon-operatingitems 96.8 77.9 12.3 9.8 5.2
Shareofprotsofjointventurecompanies 50.8 57.9 40.6 12.5 6.4
Shareofprots/(losses)ofassociatedcompanies 110.2 79.0 255.2 203.7 (39.0)
SurplusonsaleofSIABuilding - 223.3 - - -
SurplusonsaleofinvestmentinSingaporeAircraft
LeasingEnterprisePteLtd - 197.7 - - -
Staffcompensationandrestructuringofoperations - - - (37.8) (41.4)
SurplusonsaleofinvestmentinAirNewZealand
Limited - - - 45.7 -
SurplusonsaleofinvestmentinRafesHoldingsLtd - - - 32.6 -
SurplusonsaleofinvestmentinTaikoo(Xiamen)
AircraftEngineeringCompanyLimited - - - 9.0 -
SurplusonliquidationofAbacusDistribution
SystemsPteLtd - - - - 9.2
SurplusondisposalofAviationSoftware
DevelopmentConsultancyIndiaLimited - - - - 1.1
Totalvalueaddedavailablefordistribution 7,082.1 6,510.1 5,534.0 5,533.6 3,910.4
Appliedasfollows:
Toemployees
- Salariesandotherstaffcosts 2,903.4 2,727.4 2,481.1 2,456.5 1,981.0
Togovernment
- Corporationtaxes 410.3 328.9 352.6 387.3 130.3
Tosuppliersofcapital
- Interimandproposeddividends 1,184.4 1,245.2 550.5 487.4 304.5
- Financecharges 100.2 124.1 96.3 77.5 65.1
- Minorityinterests 87.5 73.6 68.8 51.3 46.0
Retainedforfuturecapitalrequirements
- Depreciationandamortisation 1,531.3 1,374.0 1,294.5 1,208.6 1,180.2
- RetainedprotR1 865.0 636.9 690.2 865.0 203.3
Totalvalueadded 7,082.1 6,510.1 5,534.0 5,533.6 3,910.4
Valueaddedper$revenue($) 0.44 0.45 0.41 0.46 0.40
Valueaddedper$employmentcost($) 2.44 2.39 2.23 2.25 1.97
Valueaddedper$investmentinproperty,plant
andequipment($) 0.29 0.27 0.23 0.24 0.16
R1 Retained profit excludes tax write-back as a result of the reduction in statutory tax rate of $246.7 million and $204.7 million for 2006-07 and
2003-04 respectively. If tax write-back were included, retained profit for 2006-07 and 2003-04 would be $883.6 million and $408.0 million
respectively.
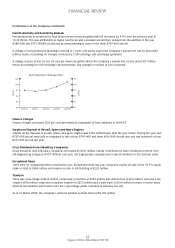
Valueaddedisameasureofwealthcreated.ThestatementaboveshowstheGroup’svalueaddedfrom2003-04to2007-08
anditsdistributionbywayofpaymentstoemployees,government,andtothosewhohaveprovidedcapital.Italsoindicates
theportionretainedinthebusinessforfuturecapitalrequirements.