Singapore Airlines 2008 Annual Report Download - page 155
Download and view the complete annual report
Please find page 155 of the 2008 Singapore Airlines annual report below. You can navigate through the pages in the report by either clicking on the pages listed below, or by using the keyword search tool below to find specific information within the annual report.-
 1
1 -
2
-
3
-
4
-
5
-
6
-
7
-
8
-
9
-
10
-
11
-
12
-
13
-
14
-
15
-
16
-
17
-
18
-
19
-
20
-
21
-
22
-
23
-
24
-
25
-
26
-
27
-
28
-
29
-
30
-
31
-
32
-
33
-
34
-
35
-
36
-
37
-
38
-
39
-
40
-
41
-
42
-
43
-
44
-
45
-
46
-
47
-
48
-
49
-
50
-
51
-
52
-
53
-
54
-
55
-
56
-
57
-
58
-
59
-
60
-
61
-
62
-
63
-
64
-
65
-
66
-
67
-
68
-
69
-
70
-
71
-
72
-
73
-
74
-
75
-
76
-
77
-
78
-
79
-
80
-
81
-
82
-
83
-
84
-
85
-
86
-
87
-
88
-
89
-
90
-
91
-
92
-
93
-
94
-
95
-
96
-
97
-
98
-
99
-
100
-
101
-
102
-
103
-
104
-
105
-
106
-
107
-
108
-
109
-
110
-
111
-
112
-
113
-
114
-
115
-
116
-
117
-
118
-
119
-
120
-
121
-
122
-
123
-
124
-
125
-
126
-
127
-
128
-
129
-
130
-
131
-
132
-
133
-
134
-
135
-
136
-
137
-
138
-
139
-
140
-
141
-
142
-
143
-
144
-
 145
145 -
 146
146 -
 147
147 -
 148
148 -
 149
149 -
 150
150 -
 151
151 -
 152
152 -
 153
153 -
 154
154 -
 155
155 -
 156
156 -
 157
157 -
 158
158 -
 159
159 -
 160
160 -
 161
161 -
 162
162 -
 163
163 -
 164
164 -
 165
165 -
166
-
167
-
168
-
169
-
170
-
171
-
172
-
173
-
174
-
175
-
176
-
177
-
178
 |
 |

Singapore Airlines Annual Report 2007-08
153
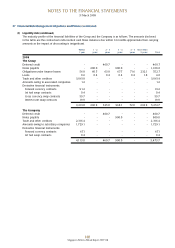
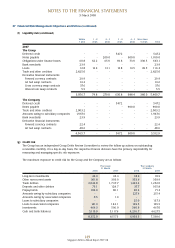
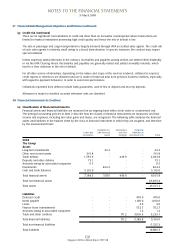
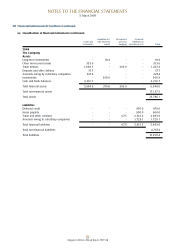
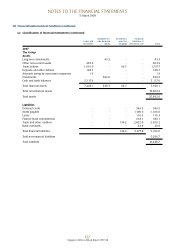
38 Financial Instruments (in $ million) (continued)
(a) Classification of financial instruments (continued)
Available-for- Derivatives Financial
Loans and sale financial used for liabilities at
receivables assets hedging amortised cost Total
2007
The Company
Assets
Long-term investments - 18.9 - - 18.9
Other non-current assets 303.9 - - - 303.9
Trade debtors 1,217.2 - 34.8 - 1,252.0
Deposits and other debtors 105.8 - - - 105.8
Amounts owing by subsidiary companies 215.4 - - - 215.4
Investments - 467.0 - - 467.0
Cash and bank balances 4,627.5 - - - 4,627.5
Total financial assets 6,469.8 485.9 34.8 - 6,990.5
Total non-financial assets 16,862.2
Total assets 23,852.7
Liabilities
Deferred credit - - - 549.5 549.5
Notes payable - - - 900.0 900.0
Trade and other creditors - - 71.0 2,003.2 2,074.2
Amounts owing to subsidiary companies - - - 1,967.6 1,967.6
Bank overdrafts - - - 23.9 23.9
Total financial liabilities - - 71.0 5,444.2 5,515.2
Total non-financial liabilities 4,245.4
Total liabilities 9,760.6
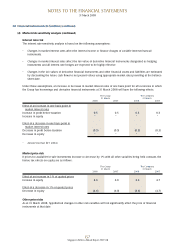
(b) Fair values
The fair value of a financial instrument is the amount at which the instrument could be exchanged or settled between
knowledgeable and willing parties in an arm’s length transaction, other than in a forced or liquidation sale.
Financial instruments carried at fair value
The Group and Company have carried all investment securities that are classified as available-for-sale financial assets
and all derivative instruments at their fair values.
The fair values of jet fuel swap contracts are the mark-to-market values of these contracts. The fair values of jet fuel
option contracts are determined by reference to available market information and the Black-Scholes option valuation
model. As the Group hedges its jet fuel requirements in Mean of Platts Singapore Jet Kerosene (“MOPS”) and that
the majority of the Group’s fuel uplifts are in MOPS, the MOPS price (as at 31 March 2008: USD128.53/BBL, 2007:
USD80.42/BBL) is used as the input for market fuel price to the Black-Scholes option valuation model. Consequently,
the annualised volatility (2007-08: 29.31%, 2006-07: 18.62%) of the jet fuel swap and jet fuel option contracts is
also estimated with daily MOPS price. The continuously compounded risk-free rate estimated as average of the past 12
months Singapore Government Securities benchmark issues’ one-year yield (2007-08: 1.97%, 2006-07: 2.97%) was
also applied to each individual jet fuel option contracts to derive their estimated fair values at balance sheet date.
The fair values of gasoil and regrade swap contracts are also determined by reference to available market information
and are the mark-to-market values of these swap contracts. As the Group hedges in InterContinental Exchange (“ICE”)
gasoil and MOPS jet-fuel-ICE gasoil regrade, the ICE gasoil futures contract price and the MOPS price are used as the
mark-to-market prices.
NOTES TO THE FINANCIAL STATEMENTS
31 March 2008