Singapore Airlines 2008 Annual Report Download - page 117
Download and view the complete annual report
Please find page 117 of the 2008 Singapore Airlines annual report below. You can navigate through the pages in the report by either clicking on the pages listed below, or by using the keyword search tool below to find specific information within the annual report.-
 1
1 -
2
-
3
-
4
-
5
-
6
-
7
-
8
-
9
-
10
-
11
-
12
-
13
-
14
-
15
-
16
-
17
-
18
-
19
-
20
-
21
-
22
-
23
-
24
-
25
-
26
-
27
-
28
-
29
-
30
-
31
-
32
-
33
-
34
-
35
-
36
-
37
-
38
-
39
-
40
-
41
-
42
-
43
-
44
-
45
-
46
-
47
-
48
-
49
-
50
-
51
-
52
-
53
-
54
-
55
-
56
-
57
-
58
-
59
-
60
-
61
-
62
-
63
-
64
-
65
-
66
-
67
-
68
-
69
-
70
-
71
-
72
-
73
-
74
-
75
-
76
-
77
-
78
-
79
-
80
-
81
-
82
-
83
-
84
-
85
-
86
-
87
-
88
-
89
-
90
-
91
-
92
-
93
-
94
-
95
-
96
-
97
-
98
-
99
-
100
-
101
-
102
-
103
-
104
-
105
-
106
-
 107
107 -
 108
108 -
 109
109 -
 110
110 -
 111
111 -
 112
112 -
 113
113 -
 114
114 -
 115
115 -
 116
116 -
 117
117 -
 118
118 -
 119
119 -
 120
120 -
 121
121 -
 122
122 -
 123
123 -
 124
124 -
 125
125 -
 126
126 -
 127
127 -
128
-
129
-
130
-
131
-
132
-
133
-
134
-
135
-
136
-
137
-
138
-
139
-
140
-
141
-
142
-
143
-
144
-
145
-
146
-
147
-
148
-
149
-
150
-
151
-
152
-
153
-
154
-
155
-
156
-
157
-
158
-
159
-
160
-
161
-
162
-
163
-
164
-
165
-
166
-
167
-
168
-
169
-
170
-
171
-
172
-
173
-
174
-
175
-
176
-
177
-
178
 |
 |

Singapore Airlines Annual Report 2007-08
115
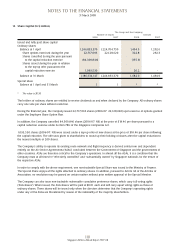
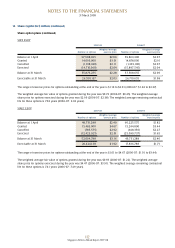
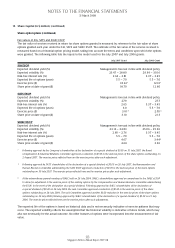
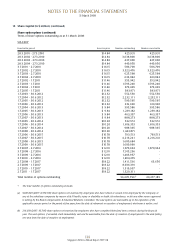
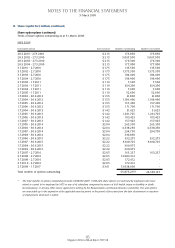
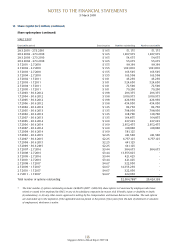
14 Share Capital (in $ million) (continued)
Share option plans (continued)
Terms of share options outstanding as at 31 March 2008:
SATS ESOP
Exercisable period Exercise price Number outstanding Number exercisable
28.3.2001 - 27.3.2010 $ 2.15 173,850 173,850
28.3.2002 - 27.3.2010 $ 2.15 5,067,050 5,067,050
28.3.2003 - 27.3.2010 $ 2.15 176,300 176,300
28.3.2004 - 27.3.2010 $ 2.15 177,000 177,000
3.7.2001 - 2.7.2010 $ 1.75 135,500 135,500
3.7.2002 - 2.7.2010 $ 1.75 1,575,350 1,575,350
3.7.2003 - 2.7.2010 $ 1.75 184,400 184,400
3.7.2004 - 2.7.2010 $ 1.75 199,400 199,400
2.7.2002 - 1.7.2011 $ 1.19 7,500 7,500
2.7.2003 - 1.7.2011 $ 1.19 624,200 624,200
2.7.2004 - 1.7.2011 $ 1.19 7,600 7,600
2.7.2005 - 1.7.2011 $ 1.19 52,600 52,600
1.7.2003 - 30.6.2012 $ 1.55 21,800 21,800
1.7.2004 - 30.6.2012 $ 1.55 1,109,400 1,109,400
1.7.2005 - 30.6.2012 $ 1.55 157,200 157,200
1.7.2006 - 30.6.2012 $ 1.55 171,700 171,700
1.7.2004 - 30.6.2013 $ 1.42 31,625 31,625
1.7.2005 - 30.6.2013 $ 1.42 1,201,725 1,201,725
1.7.2006 - 30.6.2013 $ 1.42 105,425 105,425
1.7.2007 - 30.6.2013 $ 1.42 157,925 157,925
1.7.2005 - 30.6.2014 $ 2.04 265,350 265,350
1.7.2006 - 30.6.2014 $ 2.04 4,338,250 4,338,250
1.7.2007 - 30.6.2014 $ 2.04 294,750 294,750
1.7.2008 - 30.6.2014 $ 2.04 330,850 -
1.7.2006 - 30.6.2015 $ 2.22 332,275 332,275
1.7.2007 - 30.6.2015 $ 2.22 9,818,725 9,818,725
1.7.2008 - 30.6.2015 $ 2.22 360,975 -
1.7.2009 - 30.6.2015 $ 2.22 360,975 -
3.7.2007 - 2.7.2016 $ 2.05 163,237 163,237
3.7.2008 - 2.7.2016 $ 2.05 13,986,513 -
3.7.2009 - 2.7.2016 $ 2.05 172,612 -
3.7.2010 - 2.7.2016 $ 2.05 172,613 -
2.7.2009 - 1.7.2017 $ 3.01 13,938,600 -
Total number of options outstanding 55,873,275@ 26,550,137
@ The total number of options outstanding includes 6,699,050 (2007: 7,930,225) share options not exercised by employees who have
retired or ceased to be employed by SATS or any of its subsidiary companies by reason of (i) ill health, injury or disability or death;
(ii) redundancy; or (iii) any other reason approved in writing by the Remuneration and Human Resource Committee. The said options
are exercisable up to the expiration of the applicable exercise period or the period of five years from the date of retirement or cessation
of employment, whichever is earlier.
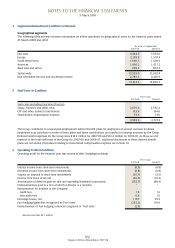
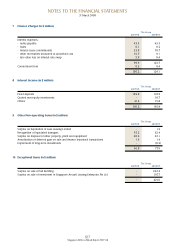
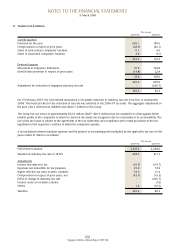
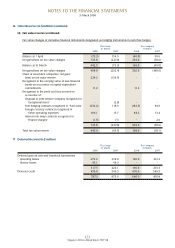
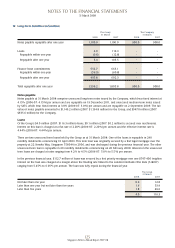
NOTES TO THE FINANCIAL STATEMENTS
31 March 2008