Singapore Airlines 2008 Annual Report Download - page 160
Download and view the complete annual report
Please find page 160 of the 2008 Singapore Airlines annual report below. You can navigate through the pages in the report by either clicking on the pages listed below, or by using the keyword search tool below to find specific information within the annual report.-
 1
1 -
2
-
3
-
4
-
5
-
6
-
7
-
8
-
9
-
10
-
11
-
12
-
13
-
14
-
15
-
16
-
17
-
18
-
19
-
20
-
21
-
22
-
23
-
24
-
25
-
26
-
27
-
28
-
29
-
30
-
31
-
32
-
33
-
34
-
35
-
36
-
37
-
38
-
39
-
40
-
41
-
42
-
43
-
44
-
45
-
46
-
47
-
48
-
49
-
50
-
51
-
52
-
53
-
54
-
55
-
56
-
57
-
58
-
59
-
60
-
61
-
62
-
63
-
64
-
65
-
66
-
67
-
68
-
69
-
70
-
71
-
72
-
73
-
74
-
75
-
76
-
77
-
78
-
79
-
80
-
81
-
82
-
83
-
84
-
85
-
86
-
87
-
88
-
89
-
90
-
91
-
92
-
93
-
94
-
95
-
96
-
97
-
98
-
99
-
100
-
101
-
102
-
103
-
104
-
105
-
106
-
107
-
108
-
109
-
110
-
111
-
112
-
113
-
114
-
115
-
116
-
117
-
118
-
119
-
120
-
121
-
122
-
123
-
124
-
125
-
126
-
127
-
128
-
129
-
130
-
131
-
132
-
133
-
134
-
135
-
136
-
137
-
138
-
139
-
140
-
141
-
142
-
143
-
144
-
145
-
146
-
147
-
148
-
149
-
 150
150 -
 151
151 -
 152
152 -
 153
153 -
 154
154 -
 155
155 -
 156
156 -
 157
157 -
 158
158 -
 159
159 -
 160
160 -
 161
161 -
 162
162 -
 163
163 -
 164
164 -
 165
165 -
 166
166 -
 167
167 -
 168
168 -
 169
169 -
 170
170 -
171
-
172
-
173
-
174
-
175
-
176
-
177
-
178
 |
 |

Singapore Airlines Annual Report 2007-08
158
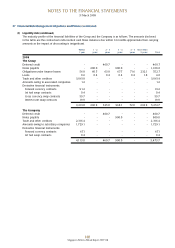
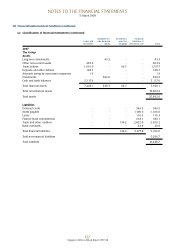
39 Capital Management (in $ million)
The primary objective of the management of the Company’s capital structure is to maintain an efficient mix of debt and
equity in order to achieve a low cost of capital, while taking into account the desirability of retaining financial flexibility to
pursue business opportunities and adequate access to liquidity to mitigate the effect of unforeseen events on cash flows.
The Directors regularly review the Company’s capital structure and make adjustments to reflect economic conditions,
business strategies and future commitments.
The Group monitors capital using a gearing ratio, which is total debt divided by total capital.
The Company did not breach any gearing covenants during the financial years ended 31 March 2008 or 31 March 2007. In
the same period, no significant changes were made in the objectives, policies or processes relating to the management of
the Company’s capital structure.
During the financial year ended 31 March 2008, the Company made a cash distribution to shareholders totalling
approximately $2.2 billion by way of a special dividend and the cancellation of one for every 15 issued shares.
The Group The Company
31 March 31 March
2008 2007 2008 2007
Notes payable 1,100.0 1,100.0 900.0 900.0
Finance lease commitments 552.7 663.1 - -
Loans 4.0 116.3 - -
Total debt 1,656.7 1,879.4 900.0 900.0
Share capital 1,682.0 1,494.9 1,682.0 1,494.9
Reserves 13,443.2 13,605.1 11,853.7 12,597.2
Total capital 15,125.2 15,100.0 13,535.7 14,092.1
Gearing ratio (times) 0.11 0.12 0.07 0.06
40 Related Party Transactions (in $ million)
For the purposes of these financial statements, parties are considered to be related to the Group if the Group has the ability,
directly or indirectly, to control the party or exercise significant influence over the party in making financial and operating
decisions, or vice versa, or where the Group and the party are subject to common control or common significant influence.
Related parties may be individuals or other entities.
In addition to the related party information disclosed elsewhere in the financial statements, these were the following
significant related party transactions which were carried out in the normal course of business on terms that prevail in arm’s
length transactions during the financial year:
The Group The Company
2007-08 2006-07 2007-08 2006-07
Purchases of services from subsidiary companies - - 775.7 691.7
Services rendered to subsidiary companies - - (1,309.9) (1,261.2)
Purchases of services from associated companies 166.0 259.8 147.3 241.3
Services rendered to associated companies (68.9) (67.8) (15.8) (19.5)
Purchases of services from joint venture companies 148.4 397.0 148.4 397.0
Services rendered to joint venture companies (111.4) (108.9) (98.5) (99.7)
NOTES TO THE FINANCIAL STATEMENTS
31 March 2008