Singapore Airlines 2008 Annual Report Download - page 125
Download and view the complete annual report
Please find page 125 of the 2008 Singapore Airlines annual report below. You can navigate through the pages in the report by either clicking on the pages listed below, or by using the keyword search tool below to find specific information within the annual report.-
 1
1 -
2
-
3
-
4
-
5
-
6
-
7
-
8
-
9
-
10
-
11
-
12
-
13
-
14
-
15
-
16
-
17
-
18
-
19
-
20
-
21
-
22
-
23
-
24
-
25
-
26
-
27
-
28
-
29
-
30
-
31
-
32
-
33
-
34
-
35
-
36
-
37
-
38
-
39
-
40
-
41
-
42
-
43
-
44
-
45
-
46
-
47
-
48
-
49
-
50
-
51
-
52
-
53
-
54
-
55
-
56
-
57
-
58
-
59
-
60
-
61
-
62
-
63
-
64
-
65
-
66
-
67
-
68
-
69
-
70
-
71
-
72
-
73
-
74
-
75
-
76
-
77
-
78
-
79
-
80
-
81
-
82
-
83
-
84
-
85
-
86
-
87
-
88
-
89
-
90
-
91
-
92
-
93
-
94
-
95
-
96
-
97
-
98
-
99
-
100
-
101
-
102
-
103
-
104
-
105
-
106
-
107
-
108
-
109
-
110
-
111
-
112
-
113
-
114
-
 115
115 -
 116
116 -
 117
117 -
 118
118 -
 119
119 -
 120
120 -
 121
121 -
 122
122 -
 123
123 -
 124
124 -
 125
125 -
 126
126 -
 127
127 -
 128
128 -
 129
129 -
 130
130 -
 131
131 -
 132
132 -
 133
133 -
 134
134 -
 135
135 -
136
-
137
-
138
-
139
-
140
-
141
-
142
-
143
-
144
-
145
-
146
-
147
-
148
-
149
-
150
-
151
-
152
-
153
-
154
-
155
-
156
-
157
-
158
-
159
-
160
-
161
-
162
-
163
-
164
-
165
-
166
-
167
-
168
-
169
-
170
-
171
-
172
-
173
-
174
-
175
-
176
-
177
-
178
 |
 |

Singapore Airlines Annual Report 2007-08
123
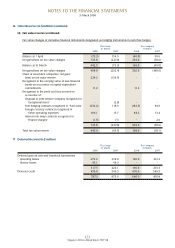
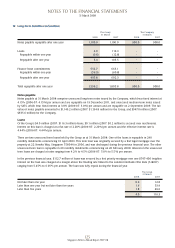
16 Other Reserves (in $ million) (continued)
(d) Fair value reserve (continued)
Fair value changes of derivative financial instruments designated as hedging instruments in cash flow hedges:
The Group The Company
31 March 31 March
2008 2007 2008 2007
Balance at 1 April (73.3) 154.5 (40.0) 30.6
Net gain/(loss) on fair value changes 515.8 (227.8) 239.0 (70.6)
Balance at 31 March 442.5 (73.3) 199.0 (40.0)
Net gain/(loss) on fair value changes 408.0 (232.4) 326.9 (180.6)
Share of associated companies’ net gain/
(loss) on fair value reserve 224.2 (134.5) - -
Recognised in the carrying value of non-financial
assets on occurrence of capital expenditure
commitments 11.2 - 11.2 -
Recognised in the profit and loss account on
occurrence of:
Disposal of joint venture company recognised in
“Exceptional items” - (2.8) - -
Fuel hedging contracts recognised in “Fuel costs” (232.2) 118.9 (183.3) 94.0
Foreign currency contracts recognised in
“Other operating expenses” 106.1 15.7 84.2 13.4
Interest rate swap contracts recognised in
“Finance charges” (1.5) 7.3 - 2.6
515.8 (227.8) 239.0 (70.6)
Total fair value reserve 443.4 (45.5) 198.6 (18.1)
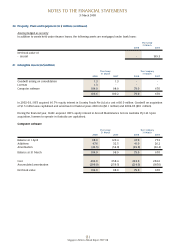
17 Deferred Account (in $ million)
The Group The Company
31 March 31 March
2008 2007 2008 2007
Deferred gain on sale and leaseback transactions
- operating leases 272.2 374.8 190.0 261.3
- finance leases 45.1 49.3 - -
317.3 424.1 190.0 261.3
Deferred credit 470.0 549.5 470.0 549.5
787.3 973.6 660.0 810.8
NOTES TO THE FINANCIAL STATEMENTS
31 March 2008