Singapore Airlines 2008 Annual Report Download - page 58
Download and view the complete annual report
Please find page 58 of the 2008 Singapore Airlines annual report below. You can navigate through the pages in the report by either clicking on the pages listed below, or by using the keyword search tool below to find specific information within the annual report.-
 1
1 -
2
-
3
-
4
-
5
-
6
-
7
-
8
-
9
-
10
-
11
-
12
-
13
-
14
-
15
-
16
-
17
-
18
-
19
-
20
-
21
-
22
-
23
-
24
-
25
-
26
-
27
-
28
-
29
-
30
-
31
-
32
-
33
-
34
-
35
-
36
-
37
-
38
-
39
-
40
-
41
-
42
-
43
-
44
-
45
-
46
-
47
-
 48
48 -
 49
49 -
 50
50 -
 51
51 -
 52
52 -
 53
53 -
 54
54 -
 55
55 -
 56
56 -
 57
57 -
 58
58 -
 59
59 -
 60
60 -
 61
61 -
 62
62 -
 63
63 -
 64
64 -
 65
65 -
 66
66 -
 67
67 -
 68
68 -
69
-
70
-
71
-
72
-
73
-
74
-
75
-
76
-
77
-
78
-
79
-
80
-
81
-
82
-
83
-
84
-
85
-
86
-
87
-
88
-
89
-
90
-
91
-
92
-
93
-
94
-
95
-
96
-
97
-
98
-
99
-
100
-
101
-
102
-
103
-
104
-
105
-
106
-
107
-
108
-
109
-
110
-
111
-
112
-
113
-
114
-
115
-
116
-
117
-
118
-
119
-
120
-
121
-
122
-
123
-
124
-
125
-
126
-
127
-
128
-
129
-
130
-
131
-
132
-
133
-
134
-
135
-
136
-
137
-
138
-
139
-
140
-
141
-
142
-
143
-
144
-
145
-
146
-
147
-
148
-
149
-
150
-
151
-
152
-
153
-
154
-
155
-
156
-
157
-
158
-
159
-
160
-
161
-
162
-
163
-
164
-
165
-
166
-
167
-
168
-
169
-
170
-
171
-
172
-
173
-
174
-
175
-
176
-
177
-
178
 |
 |
$Million
$Million
InternallyGeneratedCashFlow($million)
0
1,000
2,000
3,000
4,000
5,000
6,000
0
1,000
2,000
3,000
4,000
5,000
6,000
2007-082006-072005-062004-052003-04
Internally Generated Cash Flow
DividendCover(Times)
InterimDividend(¢)
FinalDividend(¢)
SpecialDividend(¢)
Cents
Times
0
10
20
30
40
50
60
70
80
90
100
0.0
0.5
1.0
1.5
2.0
2.5
3.0
2007-082006-072005-062004-052003-04
Dividend Payout
CashFlow:CapitalExpenditureRatio(Times)
CapitalExpenditureOnAircraft,EnginesandSpares($million)
OtherCapitalExpenditure($million)
$Million
Times
0
500
1,000
1,500
2,000
2,500
3,000
3,500
0.5
0.8
1.1
1.4
1.7
2.0
2.3
2.6
2007-082006-072005-062004-052003-04
Group Capital Expenditure
Singapore Airlines Annual Report 2007-08
56
FINANCIAL REVIEW
Performance of the Group (continued)
Financial Position of the Group (continued)
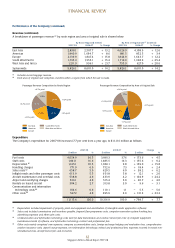
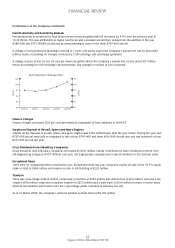
Forthenancialyearended31March2008,theBoardrecommendsatotaldistributionof100centspershare,comprising
20centsinterimdividendpaidon30November2007andarecommendednaldividendof80centspershare(taxexempt
one-tier).Thedividendcoveris1.7times.
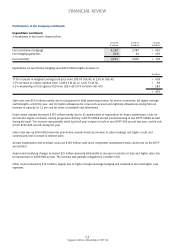
Capital Expenditure and Cash Flow of the Group
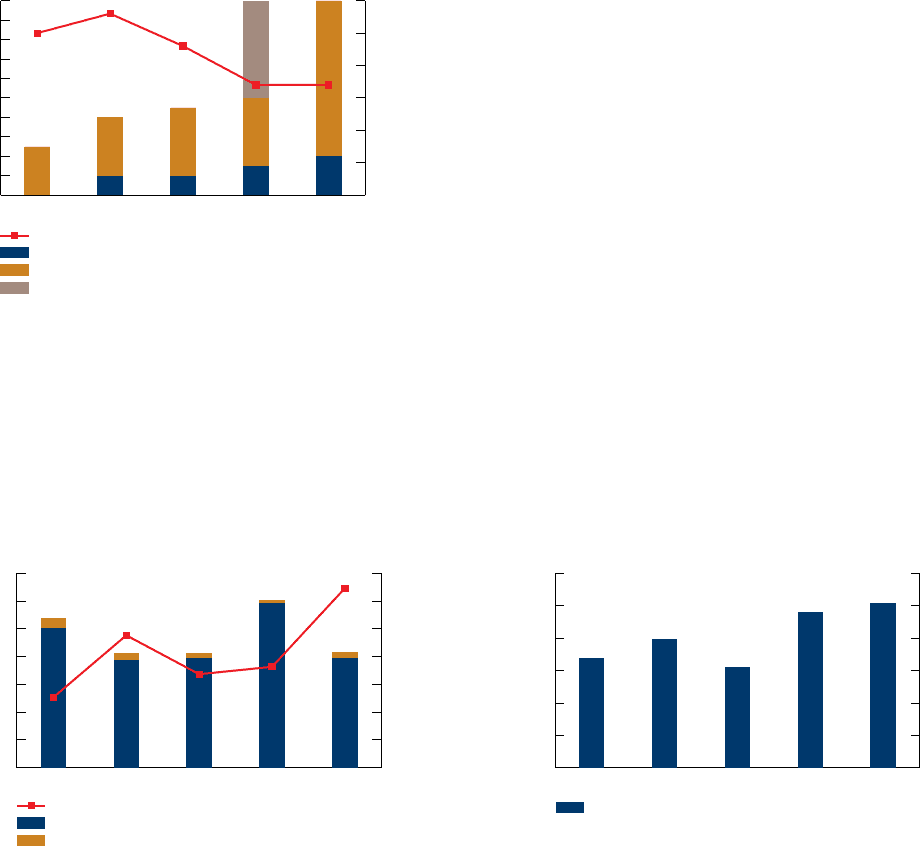
Capitalexpenditurewas$2,089million,31.0percentlowerthantheyearbefore.Internallygeneratedcashowof$5,092
million(+5.6percent)was2.44timescapitalexpenditure.Theincreaseininternallygeneratedcashowwasdrivenprimarily
byhighercashgeneratedfromoperationsanddividendsreceivedfromassociatedandjointventurecompanies,offsetby
lowerproceedsfromdisposalofaircraftandotherassets.About94percentofthecapitalspendingwasonaircraftandspare
engines.