Singapore Airlines 2008 Annual Report Download - page 166
Download and view the complete annual report
Please find page 166 of the 2008 Singapore Airlines annual report below. You can navigate through the pages in the report by either clicking on the pages listed below, or by using the keyword search tool below to find specific information within the annual report.-
 1
1 -
2
-
3
-
4
-
5
-
6
-
7
-
8
-
9
-
10
-
11
-
12
-
13
-
14
-
15
-
16
-
17
-
18
-
19
-
20
-
21
-
22
-
23
-
24
-
25
-
26
-
27
-
28
-
29
-
30
-
31
-
32
-
33
-
34
-
35
-
36
-
37
-
38
-
39
-
40
-
41
-
42
-
43
-
44
-
45
-
46
-
47
-
48
-
49
-
50
-
51
-
52
-
53
-
54
-
55
-
56
-
57
-
58
-
59
-
60
-
61
-
62
-
63
-
64
-
65
-
66
-
67
-
68
-
69
-
70
-
71
-
72
-
73
-
74
-
75
-
76
-
77
-
78
-
79
-
80
-
81
-
82
-
83
-
84
-
85
-
86
-
87
-
88
-
89
-
90
-
91
-
92
-
93
-
94
-
95
-
96
-
97
-
98
-
99
-
100
-
101
-
102
-
103
-
104
-
105
-
106
-
107
-
108
-
109
-
110
-
111
-
112
-
113
-
114
-
115
-
116
-
117
-
118
-
119
-
120
-
121
-
122
-
123
-
124
-
125
-
126
-
127
-
128
-
129
-
130
-
131
-
132
-
133
-
134
-
135
-
136
-
137
-
138
-
139
-
140
-
141
-
142
-
143
-
144
-
145
-
146
-
147
-
148
-
149
-
150
-
151
-
152
-
153
-
154
-
155
-
 156
156 -
 157
157 -
 158
158 -
 159
159 -
 160
160 -
 161
161 -
 162
162 -
 163
163 -
 164
164 -
 165
165 -
 166
166 -
 167
167 -
 168
168 -
 169
169 -
 170
170 -
 171
171 -
 172
172 -
 173
173 -
 174
174 -
 175
175 -
 176
176 -
177
-
178
 |
 |

Singapore Airlines Annual Report 2007-08
164
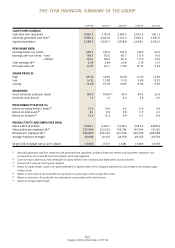
FIVE-YEAR FINANCIAL SUMMARY OF THE GROUP
2007-08 2006-07 2005-06 2004-05 2003-04
CASH FLOW ($ million)
Cash flow from operations 4,465.7 3,175.8 2,380.3 2,853.3 1,811.3
Internally generated cash flow R1 5,092.2 4,823.0 3,101.2 3,990.2 3,385.5
Capital expenditure 2,088.6 3,026.7 2,058.8 2,068.1 2,692.6
PER SHARE DATA
Earnings before tax (cents) 209.5 185.2 136.3 147.0 56.2
Earnings after tax (cents) – basic 168.5 172.6 101.7 111.0 61.6
– diluted 166.1 170.8 101.3 111.0 61.6
Cash earnings ($) R2 2.94 2.84 2.08 2.10 1.61
Net asset value ($) 12.77 12.11 11.00 10.13 9.33
SHARE PRICE ($)
High 20.20 18.00 14.90 12.70 12.90
Low 14.12 12.00 11.10 9.40 8.25
Closing 15.60 16.60 14.00 11.90 11.00
DIVIDENDS
Gross dividends (cents per share) 100.0 100.0 R3 45.0 40.0 25.0
Dividend cover (times) 1.7 1.7 2.3 2.8 2.5
PROFITABILITY RATIOS (%)
Return on equity holders’ funds R4 13.6 14.9 9.6 11.4 6.8
Return on total assets R5 8.1 8.9 5.8 6.7 4.1
Return on turnover R6 13.4 15.2 9.8 11.7 8.2
PRODUCTIVITY AND EMPLOYEE DATA
Valueadded($million) 7,082.1 6,510.1 5,534.0 5,533.6 3,898.9
Valueaddedperemployee($) R7 235,380 223,523 193,781 193,794 131,126
Revenue per employee ($) R7 530,859 497,662 467,158 420,708 328,308
Average employee strength 30,088 29,125 28,558 28,554 29,734
S$ per US$ exchange rate as at 31 March 1.3807 1.5171 1.6181 1.6496 1.6759
R1 Internally generated cash flow comprises cash generated from operations, dividends from joint venture and associated companies, and
proceeds from sale of aircraft and other property, plant and equipment.
R2 Cash earnings is defined as profit attributable to equity holders of the Company plus depreciation and amortisation.
R3 Includes 50.0 cents per share special dividend.
R4 Return on equity holders’ funds is the profit attributable to equity holders of the Company expressed as a percentage of the average equity
holders’ funds.
R5 Return on total assets is the profit after tax expressed as a percentage of the average total assets.
R6 Return on turnover is the profit after tax expressed as a percentage of the total revenue.
R7 Based on average staff strength.