Singapore Airlines 2008 Annual Report Download - page 69
Download and view the complete annual report
Please find page 69 of the 2008 Singapore Airlines annual report below. You can navigate through the pages in the report by either clicking on the pages listed below, or by using the keyword search tool below to find specific information within the annual report.-
 1
1 -
2
-
3
-
4
-
5
-
6
-
7
-
8
-
9
-
10
-
11
-
12
-
13
-
14
-
15
-
16
-
17
-
18
-
19
-
20
-
21
-
22
-
23
-
24
-
25
-
26
-
27
-
28
-
29
-
30
-
31
-
32
-
33
-
34
-
35
-
36
-
37
-
38
-
39
-
40
-
41
-
42
-
43
-
44
-
45
-
46
-
47
-
48
-
49
-
50
-
51
-
52
-
53
-
54
-
55
-
56
-
57
-
58
-
 59
59 -
 60
60 -
 61
61 -
 62
62 -
 63
63 -
 64
64 -
 65
65 -
 66
66 -
 67
67 -
 68
68 -
 69
69 -
 70
70 -
 71
71 -
 72
72 -
 73
73 -
 74
74 -
 75
75 -
 76
76 -
 77
77 -
 78
78 -
 79
79 -
80
-
81
-
82
-
83
-
84
-
85
-
86
-
87
-
88
-
89
-
90
-
91
-
92
-
93
-
94
-
95
-
96
-
97
-
98
-
99
-
100
-
101
-
102
-
103
-
104
-
105
-
106
-
107
-
108
-
109
-
110
-
111
-
112
-
113
-
114
-
115
-
116
-
117
-
118
-
119
-
120
-
121
-
122
-
123
-
124
-
125
-
126
-
127
-
128
-
129
-
130
-
131
-
132
-
133
-
134
-
135
-
136
-
137
-
138
-
139
-
140
-
141
-
142
-
143
-
144
-
145
-
146
-
147
-
148
-
149
-
150
-
151
-
152
-
153
-
154
-
155
-
156
-
157
-
158
-
159
-
160
-
161
-
162
-
163
-
164
-
165
-
166
-
167
-
168
-
169
-
170
-
171
-
172
-
173
-
174
-
175
-
176
-
177
-
178
 |
 |

Singapore Airlines Annual Report 2007-08
67
FINANCIAL REVIEW
Performance of the Company (continued)
Restricted Share Plan and Performance Share Plan
At the extraordinary general meeting of the Company held on 28 July 2005, the Company’s shareholders approved the
adoption of two new share plans, namely the Restricted Share Plan (“RSP”) and Performance Share Plan (“PSP”), in addition to
the Employee Share Option Plan.
As at 31 March 2008, the number of outstanding shares granted under the Company’s RSP and PSP were 788,310 and
302,653 respectively.
Depending on the achievement of pre-determined targets over a two-year period for the RSP and a three-year period for the
PSP, the final number of restricted shares and performance shares awarded could range between 0% to 120% of the initial
grant of the restricted shares and between 0% to 150% of the initial grant of the performance shares.
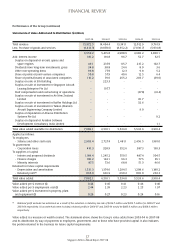
Performance of Subsidiary Companies
There were 27 subsidiary companies in the SIA Group as at 31 March 2008. The major subsidiary companies are Singapore
Airport Terminal Services Limited (“SATS”), SIA Engineering Company Limited (“SIAEC”), Singapore Airlines Cargo Pte Ltd (“SIA
Cargo”) and SilkAir (Singapore) Private Limited (“SilkAir”). The following performance review includes intra-group transactions.
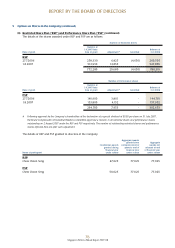
Singapore Airport Terminal Services Group
2007-08 2006-07 Change
$ million $ million %
Total revenue 958.0 945.7 + 1.3
Total expenditure 783.7 792.5 – 1.1
Operating profit 174.3 153.2 + 13.8
Profit after taxation 195.2 179.0 + 9.1
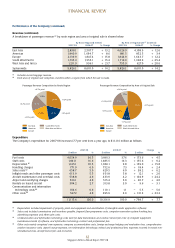
SATS Group’s operating revenue was $958 million, an increase of 1.3 per cent over the last financial year. Revenue from inflight
catering, which constituted 45.0 per cent of the total SATS Group’s revenue, increased 5.2 per cent from $410 million to $431
million due to higher number of meals uplifted. Revenue from ground handling, which constituted 45.0 per cent of the total
SATS Group’s revenue, decreased 1.3 per cent from $437 million to $431 million because of pressure on rates and suspension
of flights by some airline clients. Revenue from aviation security services dropped 5.4 per cent because of pressure on rates
and the cessation of hold-baggage screening contract with Civil Aviation Authority of Singapore from end August 2006.
Operating expenditure decreased $9 million (-1.1 per cent) to $784 million mainly from lower bonus provision as a result of
de-linking of the profit sharing bonus from Singapore Airlines. The reduction was partly offset by increases in check-in counter
rentals, staff costs and raw material costs. Staff costs increases were for dual terminal operations with the inauguration of
Terminal 3 at Changi Airport.
As a consequence, SATS Group’s operating profit improved $21 million (+13.8 per cent) to $174 million.
Profit contribution from overseas associated companies decreased 14.2 per cent to $45 million for the financial year ended 31
March 2008, mainly from the reduction in profits from associated companies in China and Hong Kong.
During the year, SATS Group recorded $17.3 million (or $15.5 million net of tax) from sale of Express Courier Centre 2 (“ECC2”).
Profit after taxation increased $16 million (+9.1 per cent) to $195 million, due to higher operating profit and surplus from sale
of ECC2, partly offset by lower contribution from associated companies.
As at 31 March 2008, equity holders’ funds of SATS Group were $1,384 million (+5.3 per cent). The increase was mainly
attributable to profit for the financial year of $195 million and $31 million from share options exercised. This increase was
partially offset by ordinary and special dividend payments of $96 million and $44 million respectively. Net asset value per
share of the group increased $0.05 (+4.0 per cent) to $1.29 as at 31 March 2008.
Return on equity holders’ funds at 14.4 per cent, was 0.2 percentage point higher than the last financial year. Basic earnings
per share increased 1.2 cents (+7.1 per cent) to 18.2 cents.