Singapore Airlines 2008 Annual Report Download - page 165
Download and view the complete annual report
Please find page 165 of the 2008 Singapore Airlines annual report below. You can navigate through the pages in the report by either clicking on the pages listed below, or by using the keyword search tool below to find specific information within the annual report.-
 1
1 -
2
-
3
-
4
-
5
-
6
-
7
-
8
-
9
-
10
-
11
-
12
-
13
-
14
-
15
-
16
-
17
-
18
-
19
-
20
-
21
-
22
-
23
-
24
-
25
-
26
-
27
-
28
-
29
-
30
-
31
-
32
-
33
-
34
-
35
-
36
-
37
-
38
-
39
-
40
-
41
-
42
-
43
-
44
-
45
-
46
-
47
-
48
-
49
-
50
-
51
-
52
-
53
-
54
-
55
-
56
-
57
-
58
-
59
-
60
-
61
-
62
-
63
-
64
-
65
-
66
-
67
-
68
-
69
-
70
-
71
-
72
-
73
-
74
-
75
-
76
-
77
-
78
-
79
-
80
-
81
-
82
-
83
-
84
-
85
-
86
-
87
-
88
-
89
-
90
-
91
-
92
-
93
-
94
-
95
-
96
-
97
-
98
-
99
-
100
-
101
-
102
-
103
-
104
-
105
-
106
-
107
-
108
-
109
-
110
-
111
-
112
-
113
-
114
-
115
-
116
-
117
-
118
-
119
-
120
-
121
-
122
-
123
-
124
-
125
-
126
-
127
-
128
-
129
-
130
-
131
-
132
-
133
-
134
-
135
-
136
-
137
-
138
-
139
-
140
-
141
-
142
-
143
-
144
-
145
-
146
-
147
-
148
-
149
-
150
-
151
-
152
-
153
-
154
-
 155
155 -
 156
156 -
 157
157 -
 158
158 -
 159
159 -
 160
160 -
 161
161 -
 162
162 -
 163
163 -
 164
164 -
 165
165 -
 166
166 -
 167
167 -
 168
168 -
 169
169 -
 170
170 -
 171
171 -
 172
172 -
 173
173 -
 174
174 -
 175
175 -
176
-
177
-
178
 |
 |

Singapore Airlines Annual Report 2007-08
163
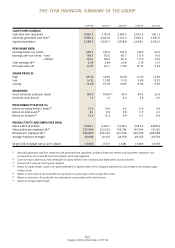
FIVE-YEAR FINANCIAL SUMMARY OF THE GROUP
2007-08 2006-07 2005-06 2004-05 2003-04
PROFIT AND LOSS ACCOUNT ($ million)
Total revenue 15,972.5 14,494.4 13,341.1 12,012.9 9,761.9
Total expenditure (13,848.0) (13,180.0) (12,127.8) (10,695.8) (9,093.0)
Operating profit 2,124.5 1,314.4 1,213.3 1,317.1 668.9
Finance charges (100.2) (124.1) (96.3) (77.5) (65.1)
Interest income 181.2 181.8 96.7 52.7 32.5
Surplus on disposal of aircraft, spares and spare engines 49.1 237.9 115.7 215.2 102.7
Dividends from long-term investments, gross 34.8 38.8 24.6 8.0 3.6
Other non-operating items 96.8 77.9 12.3 9.8 5.2
Share of profits of joint venture companies 50.8 57.9 40.6 12.5 6.4
Share of profits/(losses) of associated companies 110.2 79.0 255.2 203.7 (39.0)
Profit before exceptional items 2,547.2 1,863.6 1,662.1 1,741.5 715.2
Surplus on sale of SIA Building - 223.3 - - -
Surplus on sale of investment in
Singapore Aircraft Leasing Enterprise Pte Ltd - 197.7 - - -
Surplus on sale of investment in Air New Zealand Limited
- - - 45.7 -
Surplus on sale of investment in Raffles Holdings Ltd - - - 32.6 -
Surplus on sale of investment in Taikoo (Xiamen)
Aircraft Engineering Company Limited - - - 9.0 -
Surplus on liquidation of Abacus Distribution
Systems Pte Ltd - - - - 9.2
Surplus on disposal of Aviation Software Development
Consultancy India Limited - - - - 1.1
Staff compensation and restructuring of operations - - - (37.8) (41.4)
Profit before taxation 2,547.2 2,284.6 1,662.1 1,791.0 684.1
Profit attributable to equity holders of the Company 2,049.4 2,128.8 1,240.7 1,352.4 750.0
BALANCE SHEET ($ million)
Share capital 1,682.0 1,494.9 1,202.6 1,121.7 1,120.7
Treasury shares (33.2) - - - -
Capital reserve 95.6 44.9 40.8 41.9 32.0
Foreign currency translation reserve (130.7) (59.5) (30.5) 3.1 19.8
Share-based compensation reserve 136.4 97.3 81.8 48.4 11.5
Fair value reserve 443.4 (45.5) 163.6 - -
General reserve 12,931.7 13,567.9 12,012.3 11,127.2 10,183.3
Equity attributable to equity holders of the Company 15,125.2 15,100.0 13,470.6 12,342.3 11,367.3
Minority interests 503.7 443.3 396.3 302.8 304.1
Deferred account 787.3 973.6 349.6 414.6 446.7
Deferred taxation 2,542.1 2,410.9 2,486.1 2,450.1 2,175.3
Property, plant and equipment 16,474.1 16,311.7 15,524.7 15,161.7 15,222.9
Intangible assets R1 106.6 100.2 121.7 144.1 1.4
Associated companies 1,121.0 897.5 996.3 695.1 429.7
Joint venture companies 95.1 86.6 362.6 323.6 309.2
Long-term investments 43.3 43.3 425.9 476.3 475.2
Other non-current assets 361.8 303.9 - - -
Current assets 8,313.3 8,248.8 5,938.3 4,943.9 3,463.8
Total assets 26,515.2 25,992.0 23,369.5 21,744.7 19,902.2
Long-term liabilities 1,599.2 1,805.8 1,824.4 2,333.3 2,207.2
Current liabilities 5,957.7 5,258.4 4,842.5 3,901.6 3,401.6
Total liabilities 7,556.9 7,064.2 6,666.9 6,234.9 5,608.8
R1 In accordance with the revised FRS 38: Intangible Assets, the Group has reclassified the net book value of computer software from fixed assets
to intangible assets. The comparative for 2003-04 has not been restated.