Singapore Airlines 2008 Annual Report Download - page 143
Download and view the complete annual report
Please find page 143 of the 2008 Singapore Airlines annual report below. You can navigate through the pages in the report by either clicking on the pages listed below, or by using the keyword search tool below to find specific information within the annual report.-
 1
1 -
2
-
3
-
4
-
5
-
6
-
7
-
8
-
9
-
10
-
11
-
12
-
13
-
14
-
15
-
16
-
17
-
18
-
19
-
20
-
21
-
22
-
23
-
24
-
25
-
26
-
27
-
28
-
29
-
30
-
31
-
32
-
33
-
34
-
35
-
36
-
37
-
38
-
39
-
40
-
41
-
42
-
43
-
44
-
45
-
46
-
47
-
48
-
49
-
50
-
51
-
52
-
53
-
54
-
55
-
56
-
57
-
58
-
59
-
60
-
61
-
62
-
63
-
64
-
65
-
66
-
67
-
68
-
69
-
70
-
71
-
72
-
73
-
74
-
75
-
76
-
77
-
78
-
79
-
80
-
81
-
82
-
83
-
84
-
85
-
86
-
87
-
88
-
89
-
90
-
91
-
92
-
93
-
94
-
95
-
96
-
97
-
98
-
99
-
100
-
101
-
102
-
103
-
104
-
105
-
106
-
107
-
108
-
109
-
110
-
111
-
112
-
113
-
114
-
115
-
116
-
117
-
118
-
119
-
120
-
121
-
122
-
123
-
124
-
125
-
126
-
127
-
128
-
129
-
130
-
131
-
132
-
 133
133 -
 134
134 -
 135
135 -
 136
136 -
 137
137 -
 138
138 -
 139
139 -
 140
140 -
 141
141 -
 142
142 -
 143
143 -
 144
144 -
 145
145 -
 146
146 -
 147
147 -
 148
148 -
 149
149 -
 150
150 -
 151
151 -
 152
152 -
 153
153 -
154
-
155
-
156
-
157
-
158
-
159
-
160
-
161
-
162
-
163
-
164
-
165
-
166
-
167
-
168
-
169
-
170
-
171
-
172
-
173
-
174
-
175
-
176
-
177
-
178
 |
 |
Singapore Airlines Annual Report 2007-08
141
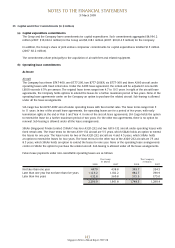
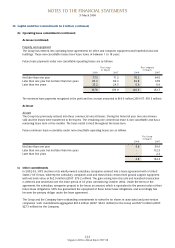
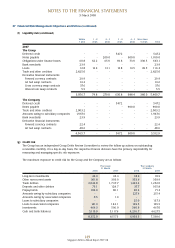
29 Deposits and Other Debtors (in $ million)
The Group The Company
31 March 31 March
2008 2007 2008 2007
Deposits 18.5 17.5 11.3 10.3
Other debtors 54.6 111.2 26.4 95.5
73.1 128.7 37.7 105.8
30 Investments (in $ million)
The Group The Company
31 March 31 March
2008 2007 2008 2007
Available-for-sale investments
Quoted investments
Government securities 8.8 4.5 - -
Equity investments 28.9 33.0 - -
Non-equity investments 382.2 485.0 360.9 467.0
419.9 522.5 360.9 467.0
Unquoted investments
Non-equity investments 44.4 73.5 - -
464.3 596.0 360.9 467.0
The Group’s non-equity investments comprise investments in money market funds, commercial papers and credit-linked
notes. No impairment loss has been recognised on these investments.
The interest rate for quoted government securities range from 2.25% to 4.63% (2007: 2.38% to 5.63%) per annum and
0.25% to 4.17% (2007: 1.13% to 4.19%) per annum for the unquoted non-equity investments.
31 Cash and Bank Balances (in $ million)
The Group The Company
31 March 31 March
2008 2007 2008 2007
Fixed deposits 4,723.7 4,385.5 4,089.0 4,084.6
Cash and bank 395.3 732.1 127.7 542.9
5,119.0 5,117.6 4,216.7 4,627.5
As at 31 March 2008, the composition of cash and bank balances held in foreign currencies by the Group is as follows:
USD – 18.4% (2007: 27.3%), EUR – 1.2% (2007: 9.1%) and JPY – 0.3% (2007: 5.6%).
Cash at bank earns interest at floating rates based on daily bank deposit rates ranging from 1.03% to 7.23% (2006-07:
2.17% to 6.27%) per annum. Short-term deposits are made for varying periods of between one day and one year
depending on the immediate cash requirements of the Group, and earn interest at the respective short-term deposit rates.
The weighted average effective interest rate for short-term deposits is 2.95% (2006-07: 4.30%) per annum.
NOTES TO THE FINANCIAL STATEMENTS
31 March 2008