Singapore Airlines 2008 Annual Report Download - page 63
Download and view the complete annual report
Please find page 63 of the 2008 Singapore Airlines annual report below. You can navigate through the pages in the report by either clicking on the pages listed below, or by using the keyword search tool below to find specific information within the annual report.-
 1
1 -
2
-
3
-
4
-
5
-
6
-
7
-
8
-
9
-
10
-
11
-
12
-
13
-
14
-
15
-
16
-
17
-
18
-
19
-
20
-
21
-
22
-
23
-
24
-
25
-
26
-
27
-
28
-
29
-
30
-
31
-
32
-
33
-
34
-
35
-
36
-
37
-
38
-
39
-
40
-
41
-
42
-
43
-
44
-
45
-
46
-
47
-
48
-
49
-
50
-
51
-
52
-
 53
53 -
 54
54 -
 55
55 -
 56
56 -
 57
57 -
 58
58 -
 59
59 -
 60
60 -
 61
61 -
 62
62 -
 63
63 -
 64
64 -
 65
65 -
 66
66 -
 67
67 -
 68
68 -
 69
69 -
 70
70 -
 71
71 -
 72
72 -
 73
73 -
74
-
75
-
76
-
77
-
78
-
79
-
80
-
81
-
82
-
83
-
84
-
85
-
86
-
87
-
88
-
89
-
90
-
91
-
92
-
93
-
94
-
95
-
96
-
97
-
98
-
99
-
100
-
101
-
102
-
103
-
104
-
105
-
106
-
107
-
108
-
109
-
110
-
111
-
112
-
113
-
114
-
115
-
116
-
117
-
118
-
119
-
120
-
121
-
122
-
123
-
124
-
125
-
126
-
127
-
128
-
129
-
130
-
131
-
132
-
133
-
134
-
135
-
136
-
137
-
138
-
139
-
140
-
141
-
142
-
143
-
144
-
145
-
146
-
147
-
148
-
149
-
150
-
151
-
152
-
153
-
154
-
155
-
156
-
157
-
158
-
159
-
160
-
161
-
162
-
163
-
164
-
165
-
166
-
167
-
168
-
169
-
170
-
171
-
172
-
173
-
174
-
175
-
176
-
177
-
178
 |
 |

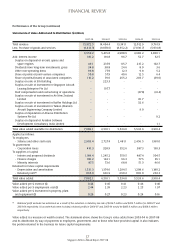
PerCent
PerCent
2007-08
2006-07
0
15
30
45
60
75
90
0
15
30
45
60
75
90
WestAsia
andAfrica
SouthWest
Pacific
EuropeAmericasEastAsia
Passenger Load Factor by Route Region
Singapore Airlines Annual Report 2007-08
61
FINANCIAL REVIEW
Performance of the Company (continued)
Operating Performance (continued)
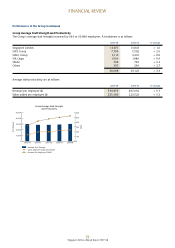
Passenger Load Factor (%)
Change
2007-08 2006-07 % points
EastAsia 75.8 74.4 + 1.4
Americas 81.1 82.2 – 1.1
Europe 84.5 83.5 + 1.0
SouthWestPacic 85.2 81.5 + 3.7
WestAsiaandAfrica 73.8 72.5 + 1.3
Systemwide 80.3 79.2 + 1.1
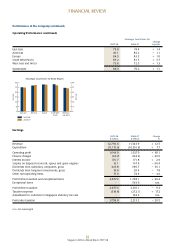
Earnings
2007-08 2006-07 Change
$ million $ million %
Revenue 12,759.6 11,343.9 + 12.5
Expenditure (11,115.6) (10,316.9) + 7.7
Operatingprot 1,644.0 1,027.0 + 60.1
Financecharges (99.7) (124.6) – 20.0
Interestincome 176.7 171.8 + 2.9
Surplusondisposalofaircraft,sparesandspareengines 16.1 167.9 – 90.4
Dividendsfromsubsidiarycompanies,gross 249.8 390.7 – 36.1
Dividendsfromlong-terminvestments,gross 18.8 20.4 – 7.8
Othernon-operatingitems 71.9 74.9 – 4.0
Protbeforetaxationandexceptionalitems 2,077.6 1,728.1 + 20.2
Exceptionalitems - 563.0 n.m.
Protbeforetaxation 2,077.6 2,291.1 – 9.3
Taxationexpense (318.8) (272.1) + 17.2
AdjustmentforreductioninSingaporestatutorytaxrate - 194.2 n.m.
Protaftertaxation 1,758.8 2,213.2 – 20.5
n.m. not meaningful