Singapore Airlines 2008 Annual Report Download - page 141
Download and view the complete annual report
Please find page 141 of the 2008 Singapore Airlines annual report below. You can navigate through the pages in the report by either clicking on the pages listed below, or by using the keyword search tool below to find specific information within the annual report.-
 1
1 -
2
-
3
-
4
-
5
-
6
-
7
-
8
-
9
-
10
-
11
-
12
-
13
-
14
-
15
-
16
-
17
-
18
-
19
-
20
-
21
-
22
-
23
-
24
-
25
-
26
-
27
-
28
-
29
-
30
-
31
-
32
-
33
-
34
-
35
-
36
-
37
-
38
-
39
-
40
-
41
-
42
-
43
-
44
-
45
-
46
-
47
-
48
-
49
-
50
-
51
-
52
-
53
-
54
-
55
-
56
-
57
-
58
-
59
-
60
-
61
-
62
-
63
-
64
-
65
-
66
-
67
-
68
-
69
-
70
-
71
-
72
-
73
-
74
-
75
-
76
-
77
-
78
-
79
-
80
-
81
-
82
-
83
-
84
-
85
-
86
-
87
-
88
-
89
-
90
-
91
-
92
-
93
-
94
-
95
-
96
-
97
-
98
-
99
-
100
-
101
-
102
-
103
-
104
-
105
-
106
-
107
-
108
-
109
-
110
-
111
-
112
-
113
-
114
-
115
-
116
-
117
-
118
-
119
-
120
-
121
-
122
-
123
-
124
-
125
-
126
-
127
-
128
-
129
-
130
-
 131
131 -
 132
132 -
 133
133 -
 134
134 -
 135
135 -
 136
136 -
 137
137 -
 138
138 -
 139
139 -
 140
140 -
 141
141 -
 142
142 -
 143
143 -
 144
144 -
 145
145 -
 146
146 -
 147
147 -
 148
148 -
 149
149 -
 150
150 -
 151
151 -
152
-
153
-
154
-
155
-
156
-
157
-
158
-
159
-
160
-
161
-
162
-
163
-
164
-
165
-
166
-
167
-
168
-
169
-
170
-
171
-
172
-
173
-
174
-
175
-
176
-
177
-
178
 |
 |

Singapore Airlines Annual Report 2007-08
139
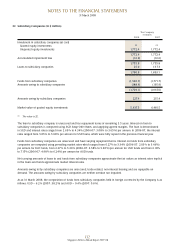
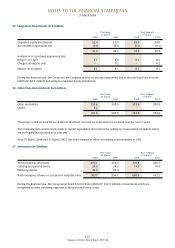
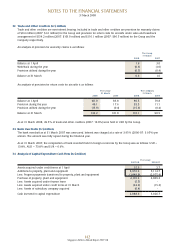
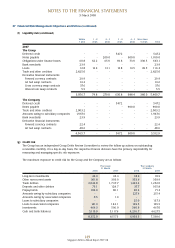
25 Long-Term Investments (in $ million)
The Group The Company
31 March 31 March
2008 2007 2008 2007
Unquoted equity investments 52.4 52.4 28.0 28.0
Accumulated impairment loss (9.1) (9.1) (9.1) (9.1)
43.3 43.3 18.9 18.9
Analysis of accumulated impairment loss:
Balance at 1 April 9.1 8.9 9.1 8.9
Charged during the year - 0.2 - 0.2
Balance at 31 March 9.1 9.1 9.1 9.1
During the financial year, the Group and the Company did not record any impairment loss in the profit and loss account
(2006-07: $0.2 million) pertaining to unquoted equity investments.
26 Other Non-Current Assets (in $ million)
The Group The Company
31 March 31 March
2008 2007 2008 2007
Other receivables 353.6 303.9 353.6 303.9
Others 8.2 - - -
361.8 303.9 353.6 303.9
The Group’s other receivables are stated at amortised cost and are expected to be received over the next 2 years.
The remaining non-current assets relate to capital expenditure incurred for the setting up of associated companies which
are not legally incorporated as at year-end.
As at 31 March 2008 and 31 March 2007, the entire balance of other receivables is denominated in USD.
27 Inventories (in $ million)
The Group The Company
31 March 31 March
2008 2007 2008 2007
Technical stocks and stores 440.1 473.4 391.8 436.5
Catering and general stocks 24.6 24.3 14.5 16.0
Work-in-progress 43.0 36.4 - -
Total inventories at lower of cost and net realisable value
507.7 534.1 406.3 452.5
During the financial year, the Group wrote down $22.0 million (2006-07: $12.6 million) of inventories which are
recognised as other operating expenses in the profit and loss account.
NOTES TO THE FINANCIAL STATEMENTS
31 March 2008